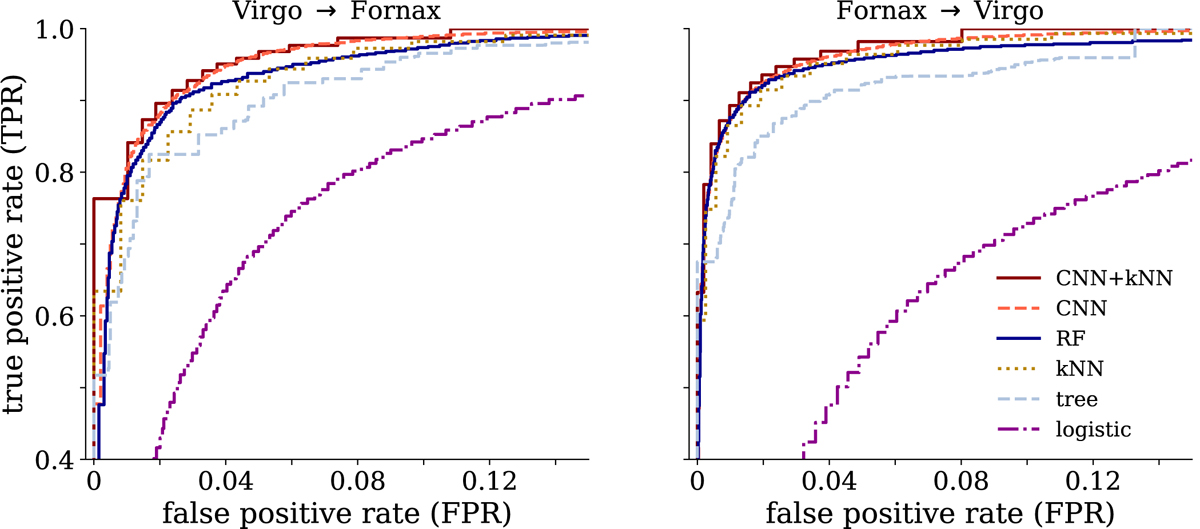
Fig. F.1.
Download original image
ROC curves for several models and (left) training on Virgo and testing on Fornax data and (right) vice versa. In both cases, CNN+kNN as well as CNN show the best characteristics, closely followed by RFs. To increase readability, we show a zoom-in here with false positives rates ranging from 0 to 0.14 and true positives rates from 0.4 to 1.
Current usage metrics show cumulative count of Article Views (full-text article views including HTML views, PDF and ePub downloads, according to the available data) and Abstracts Views on Vision4Press platform.
Data correspond to usage on the plateform after 2015. The current usage metrics is available 48-96 hours after online publication and is updated daily on week days.
Initial download of the metrics may take a while.