Fig. 10.
Download original image
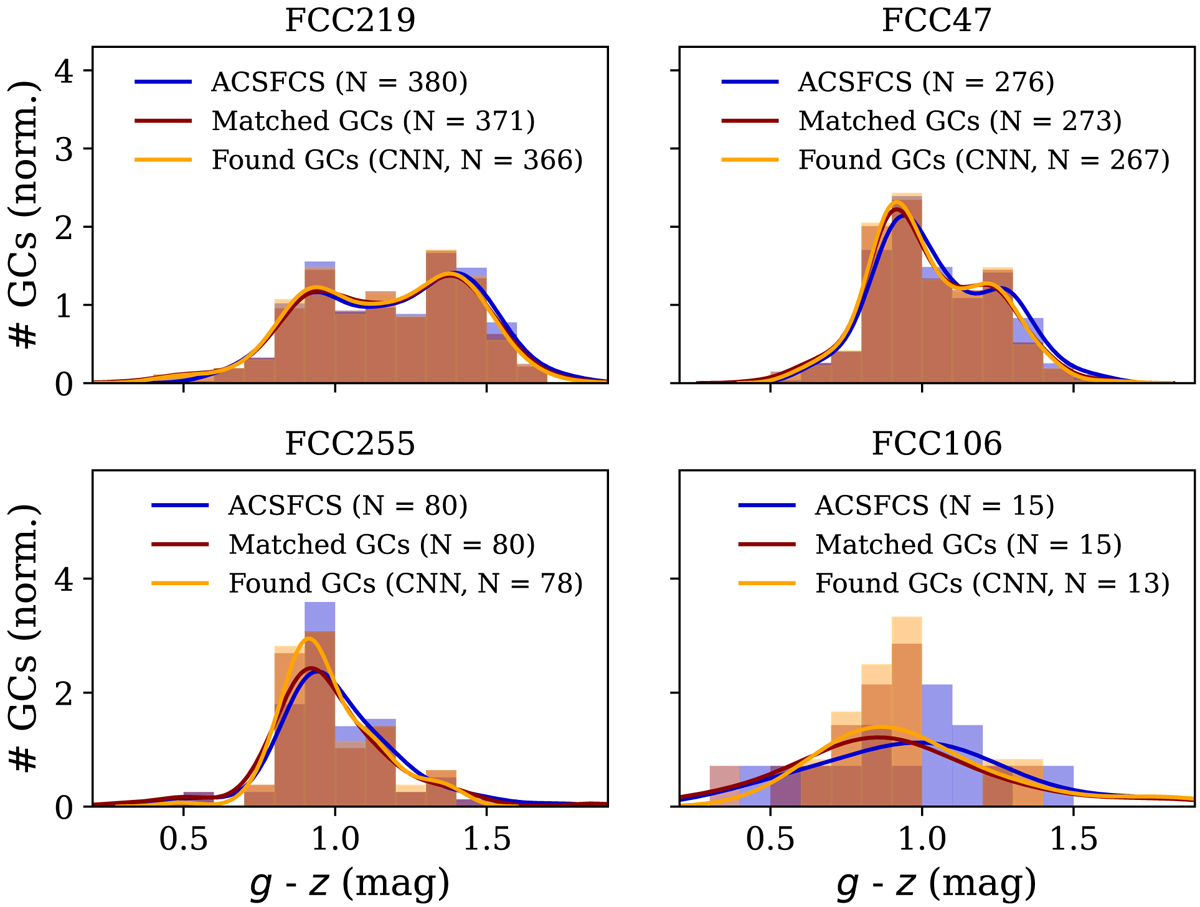
Four (g − z) colour distributions of galaxies in the Fornax cluster. Blue histograms show the original ACSFCS data, red are all matched GCs in our data set and orange histograms show the sources identified as GCs by the CNN. The corresponding lines are kernel density estimations for visualisation of the histogram shapes. The legend states the number of sources in each sample.
Current usage metrics show cumulative count of Article Views (full-text article views including HTML views, PDF and ePub downloads, according to the available data) and Abstracts Views on Vision4Press platform.
Data correspond to usage on the plateform after 2015. The current usage metrics is available 48-96 hours after online publication and is updated daily on week days.
Initial download of the metrics may take a while.