Open Access
Fig. 3.
Download original image
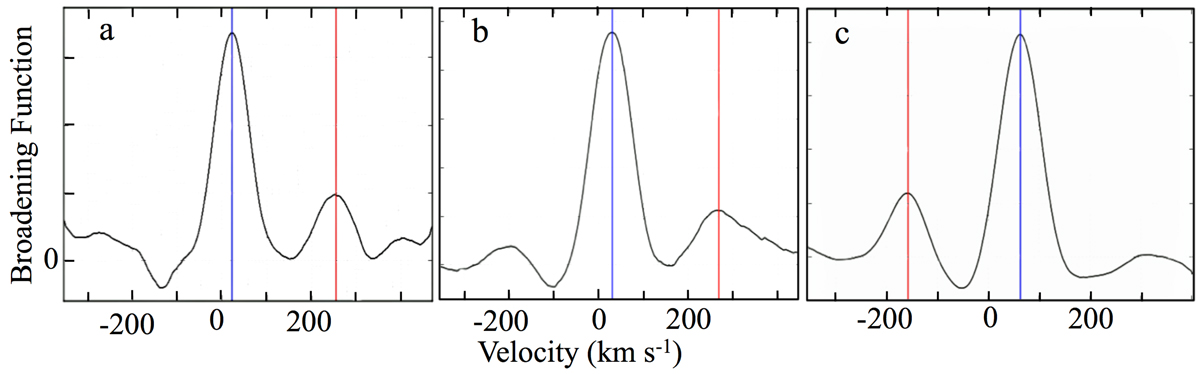
Examples of broadening functions analyses on the spectra of (a) HM Pup at phase 0.25, (b) V632 Sco at phase 0.25, and (c) TT Vel at phase 0.75. Blue lines denote the RVs of the primary and red lines those of the secondary components.
Current usage metrics show cumulative count of Article Views (full-text article views including HTML views, PDF and ePub downloads, according to the available data) and Abstracts Views on Vision4Press platform.
Data correspond to usage on the plateform after 2015. The current usage metrics is available 48-96 hours after online publication and is updated daily on week days.
Initial download of the metrics may take a while.