Open Access
Fig. 12.
Download original image
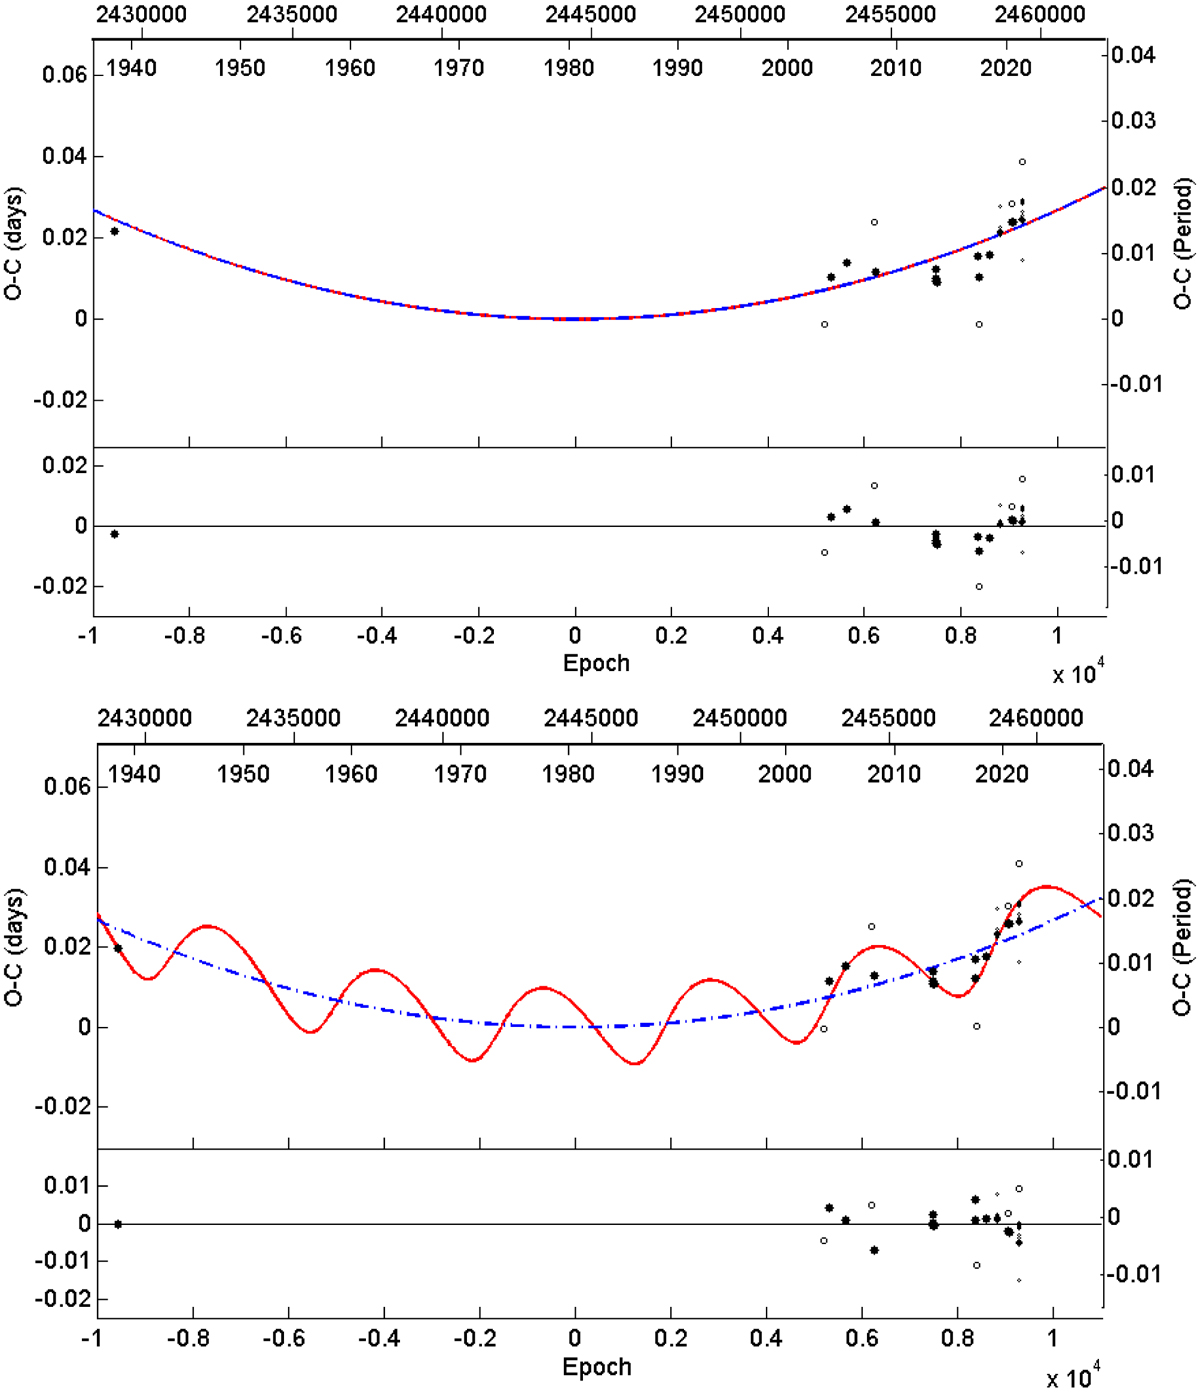
Eclipse timing variations plots for V632 Sco. Top panel: O–C points of the system fitted by a parabola (upper part) and the residuals (lower part) of the fit. Bottom panel: same as previous panel, but with the fit of a parabolic and LITE curves.
Current usage metrics show cumulative count of Article Views (full-text article views including HTML views, PDF and ePub downloads, according to the available data) and Abstracts Views on Vision4Press platform.
Data correspond to usage on the plateform after 2015. The current usage metrics is available 48-96 hours after online publication and is updated daily on week days.
Initial download of the metrics may take a while.