Open Access
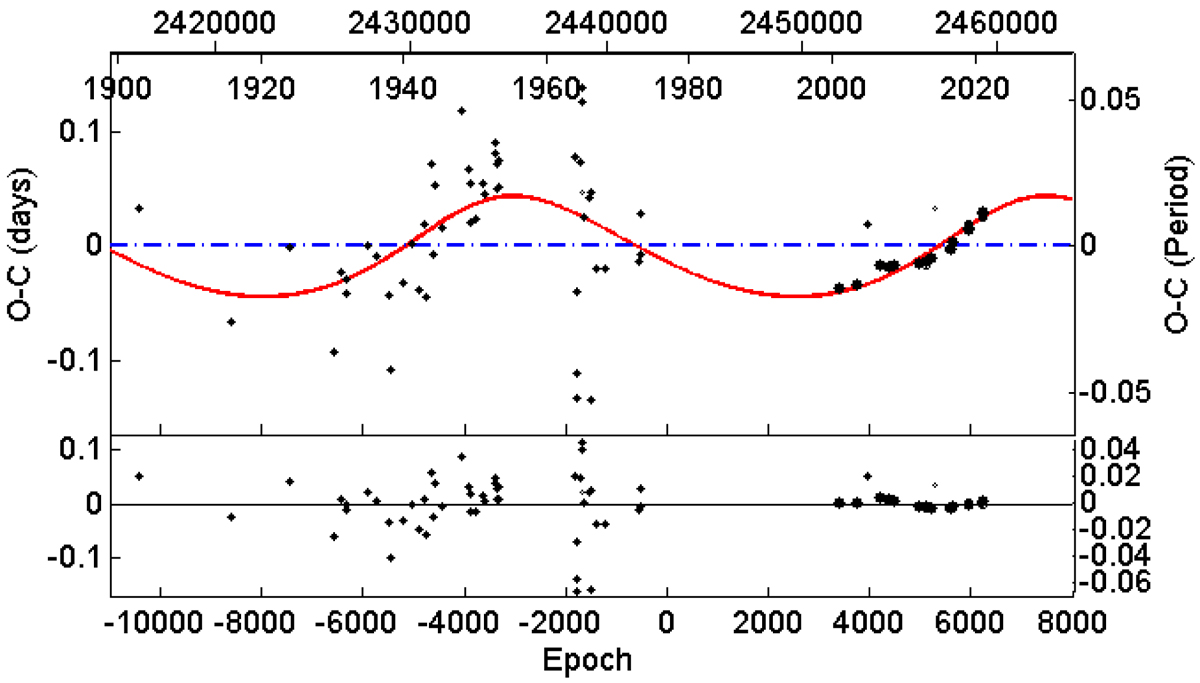
Fig. 11.
Download original image
Eclipse timing variations plot for HM Pup. Top panel: O–C points of the system fitted by a LITE curve (upper part) and the residuals (lower part) of the fit. For both panels, the bigger the symbol is, the bigger the statistical weight of the individual points.
Current usage metrics show cumulative count of Article Views (full-text article views including HTML views, PDF and ePub downloads, according to the available data) and Abstracts Views on Vision4Press platform.
Data correspond to usage on the plateform after 2015. The current usage metrics is available 48-96 hours after online publication and is updated daily on week days.
Initial download of the metrics may take a while.