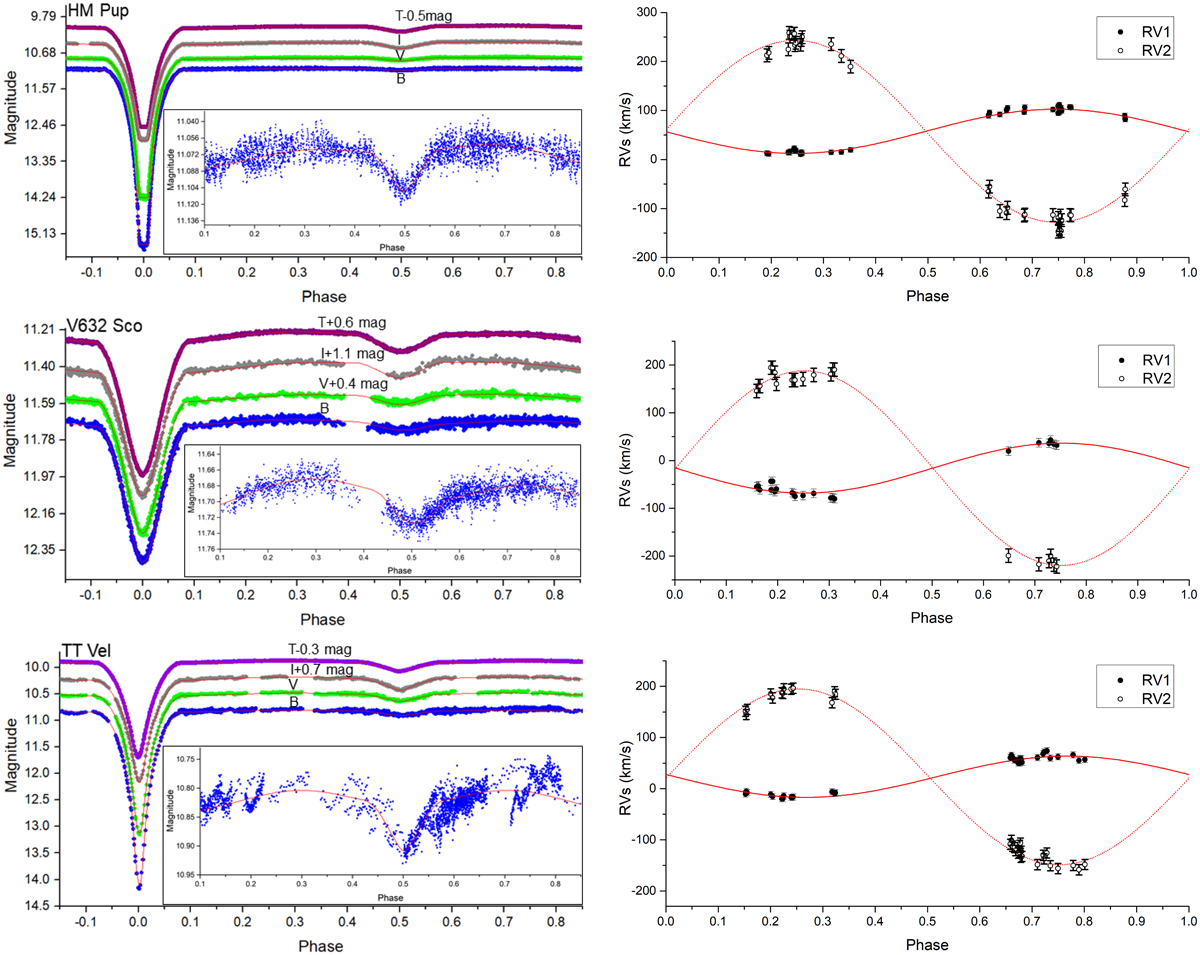
Fig. 10.
Download original image
Synthetic (solid lines) over observed (points) LCs (left plots) and RVs (right plots) for HM Pup (top panels), V632 Sco (middle panels), and TT Vel (bottom panels). Some LCs were vertically shifted for scaling reasons. The fit on the out-of-primary eclipse points of the B filter was re-scaled and plotted allowing for better viewing.
Current usage metrics show cumulative count of Article Views (full-text article views including HTML views, PDF and ePub downloads, according to the available data) and Abstracts Views on Vision4Press platform.
Data correspond to usage on the plateform after 2015. The current usage metrics is available 48-96 hours after online publication and is updated daily on week days.
Initial download of the metrics may take a while.