Free Access
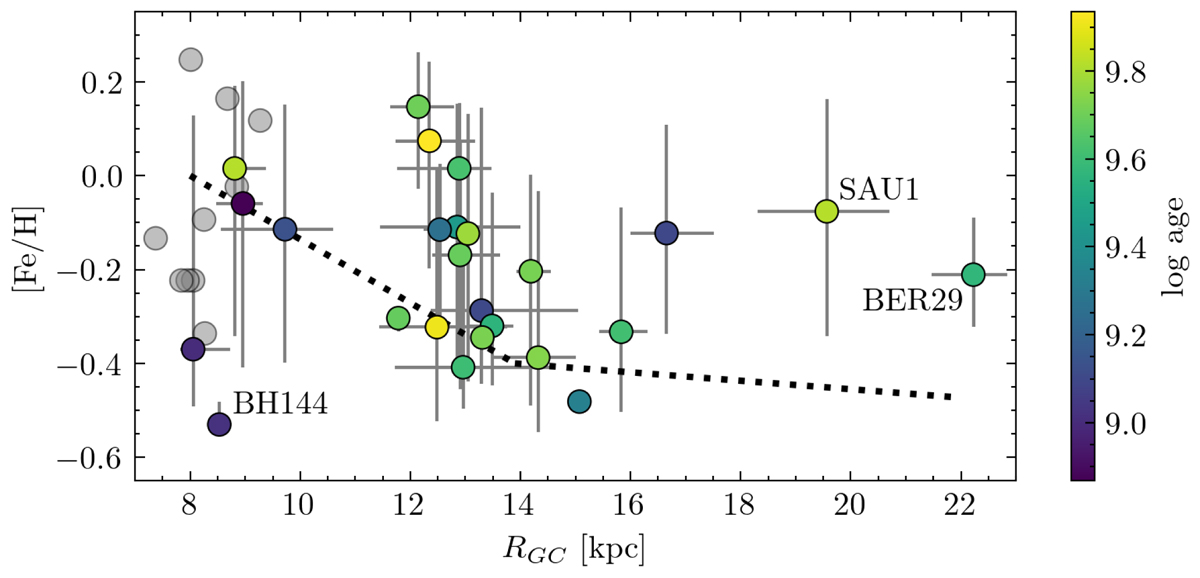
Fig. 8.
Download original image
Metallicity gradient for the set of 25 analyzed clusters. Points are colored according to the log(age). The gray vertical lines are the 16th and 84th percentiles. The dotted line is the broken relation from Donor et al. (2020, Fig. 7). The gray dots are the ten verified clusters from Perren et al. (2020).
Current usage metrics show cumulative count of Article Views (full-text article views including HTML views, PDF and ePub downloads, according to the available data) and Abstracts Views on Vision4Press platform.
Data correspond to usage on the plateform after 2015. The current usage metrics is available 48-96 hours after online publication and is updated daily on week days.
Initial download of the metrics may take a while.