Fig. 7.
Download original image
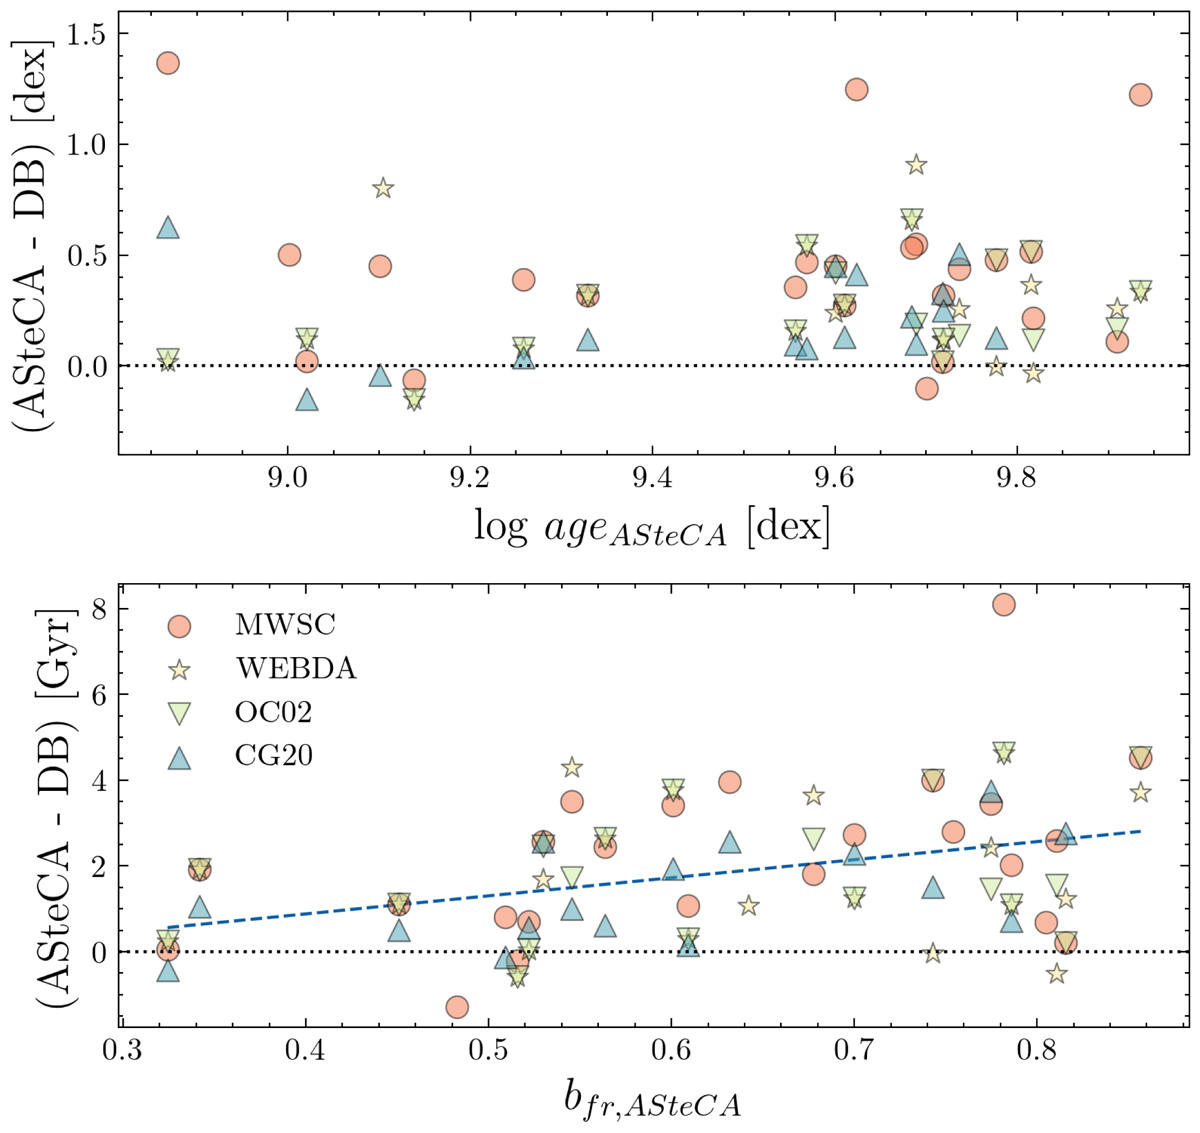
ASteCA ages vs. ages from the four databases. Top: differences in logarithmic ages between ASteCA and the databases in the sense (ASteCA – database). The cluster Kronberger 39 was left out of the plot to improve visibility. Bottom: linear age differences vs. binarity fraction assigned by ASteCA. The blue dashed line is the regression trend.
Current usage metrics show cumulative count of Article Views (full-text article views including HTML views, PDF and ePub downloads, according to the available data) and Abstracts Views on Vision4Press platform.
Data correspond to usage on the plateform after 2015. The current usage metrics is available 48-96 hours after online publication and is updated daily on week days.
Initial download of the metrics may take a while.