Fig. 6.
Download original image
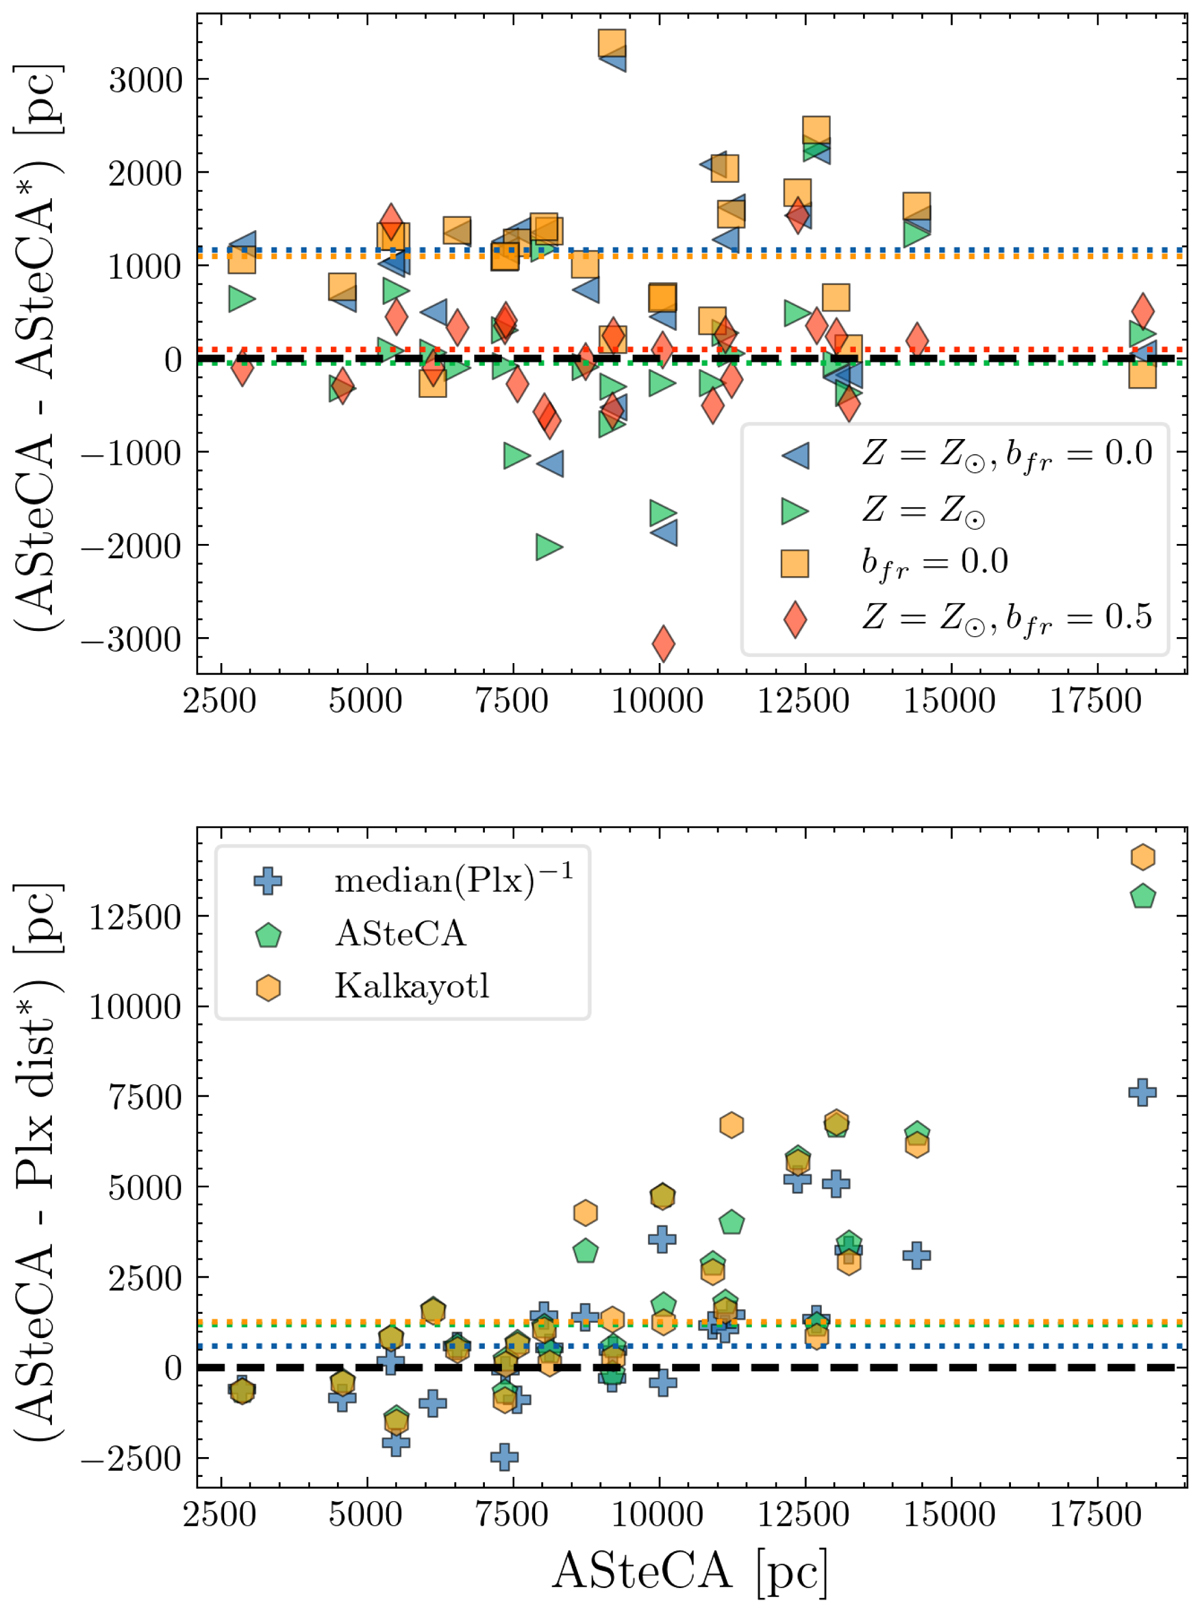
Distances obtained by the main run of ASteCA compared to other configurations and methods. In both plots the abscissa is the main run ASteCA distance values and the ordinate shows the difference in the sense (ASteCA – ASteCA*), where the asterisk represents either of the four runs from the top plot or either method from the bottom plot. In both plots the black dashed line indicates zero difference and the colored dotted lines the median differences for each run. Top: main run distances vs. four different runs where the metallicity and binary fraction were either fixed or allowed to be fitted. Bottom: main run distances vs. the difference with the distances estimated using parallax values and three different methods.
Current usage metrics show cumulative count of Article Views (full-text article views including HTML views, PDF and ePub downloads, according to the available data) and Abstracts Views on Vision4Press platform.
Data correspond to usage on the plateform after 2015. The current usage metrics is available 48-96 hours after online publication and is updated daily on week days.
Initial download of the metrics may take a while.