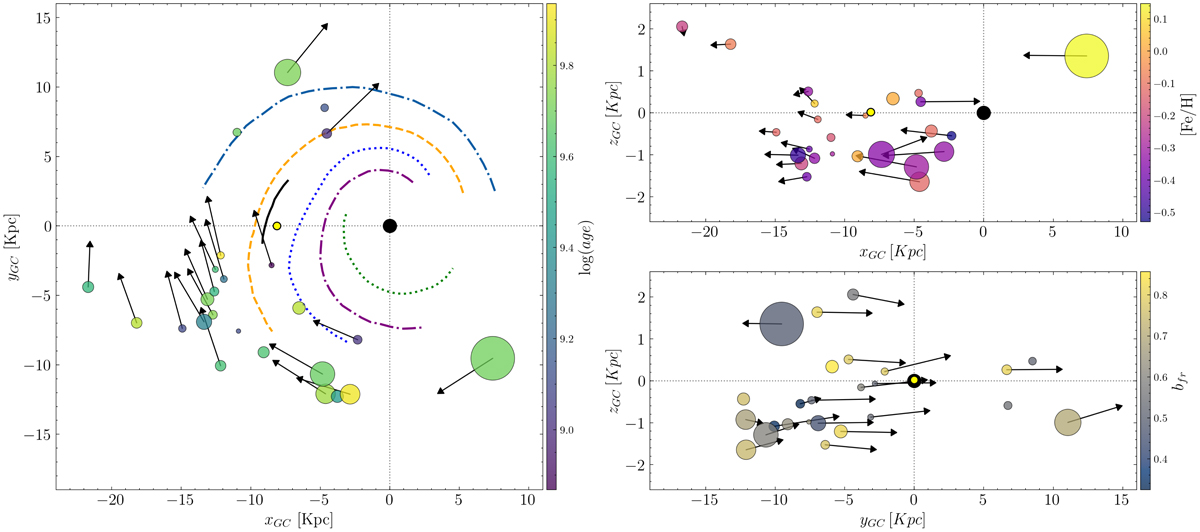
Fig. 4.
Download original image
Same as Fig. 1, but showing the positions given by our analysis with ASteCA. The velocity vectors are drawn for those clusters with available radial velocities. The length of the vectors are proportional to the velocity modules in each 2D projection. Sizes follow masses and colors follow ages, metallicities, and binary fractions for the left, top right, and bottom right plots, respectively.
Current usage metrics show cumulative count of Article Views (full-text article views including HTML views, PDF and ePub downloads, according to the available data) and Abstracts Views on Vision4Press platform.
Data correspond to usage on the plateform after 2015. The current usage metrics is available 48-96 hours after online publication and is updated daily on week days.
Initial download of the metrics may take a while.