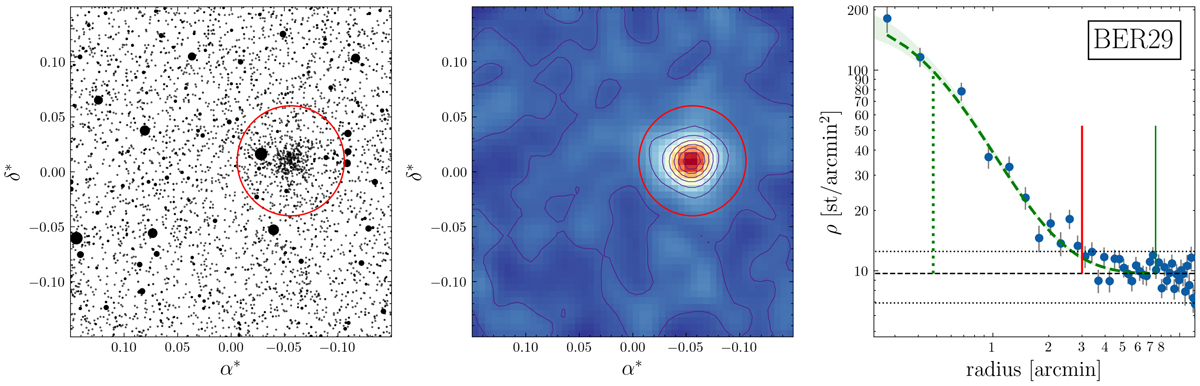
Fig. 2.
Download original image
Structural analysis for the cluster Berkeley 29. Left: analyzed 20′×20′ arcmin frame with the estimated cluster region enclosed in a red circle. Asterisks in the equatorial coordinates of the left plot indicate that these were shifted and transformed so that the center of the frame is located at (0, 0) and to remove projection artifacts. Center: same frame, but shown as a 2D density map. Right: radial density analysis, axis shown in logarithmic scale. The dashed green line and the shaded green area are the King profile fit and its 16th–84th uncertainty region, respectively. The green dotted vertical line, solid red vertical line, and solid green vertical line are respectively the core (rc), adopted (ra), and tidal (rt) radii. The dashed and dotted horizontal black lines are the field density estimate and its ±1σ region, respectively.
Current usage metrics show cumulative count of Article Views (full-text article views including HTML views, PDF and ePub downloads, according to the available data) and Abstracts Views on Vision4Press platform.
Data correspond to usage on the plateform after 2015. The current usage metrics is available 48-96 hours after online publication and is updated daily on week days.
Initial download of the metrics may take a while.