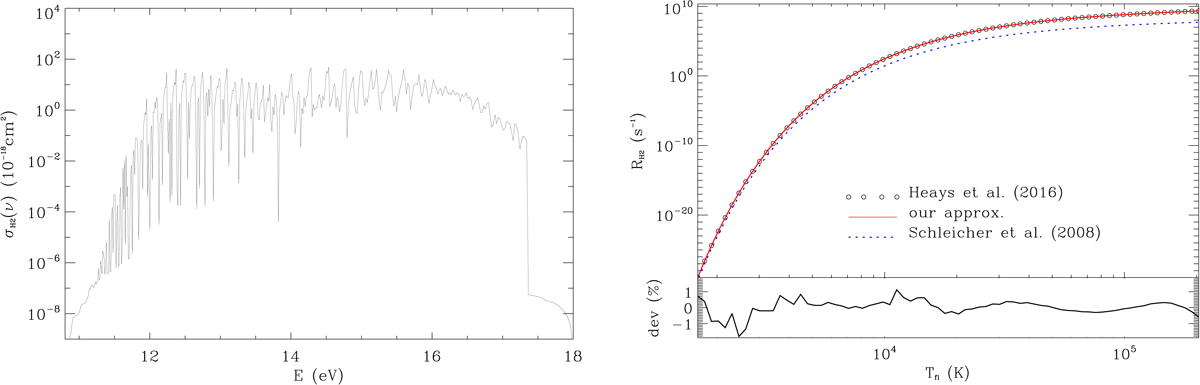
Fig. B.1.
Download original image
Effective cross-sections of hydrogen molecule H2 photodissociation from Heays et al. (2017) shown in the left panel and the rate of dissociation computed here in the right panel. The solid red line is the analytical approximation (B1), the dotted blue line is from Glover & Jappsen (2007), Schleicher et al. (2008). The deviation of analytical approximation (B1) from the numerical results is shown in the low panel.
Current usage metrics show cumulative count of Article Views (full-text article views including HTML views, PDF and ePub downloads, according to the available data) and Abstracts Views on Vision4Press platform.
Data correspond to usage on the plateform after 2015. The current usage metrics is available 48-96 hours after online publication and is updated daily on week days.
Initial download of the metrics may take a while.