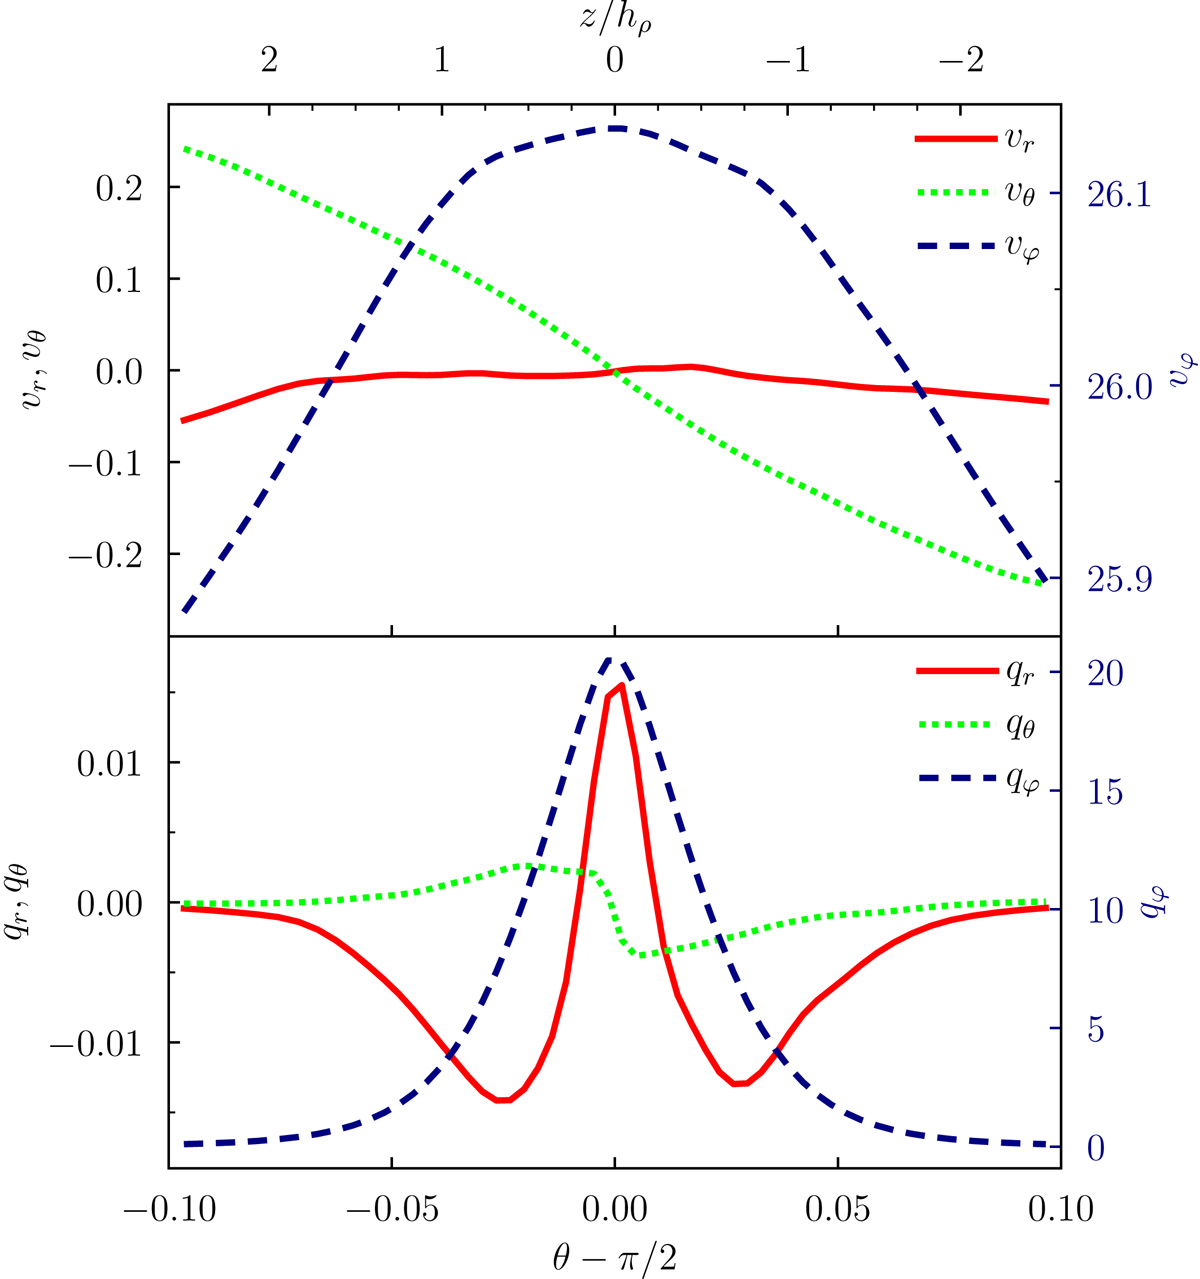
Fig. 7.
Download original image
Meridional profiles of the mean flow as defined by Eq. (5), averaged from 200tin to 400tin in run M3T10R10, and focused on the midplane region θ ∈ π/2 ± 0.1. Upper panel: spherical components of the reduced gas velocity. Lower panel: components of the reduced mass flux. The toroidal components are measured on the right vertical axes.
Current usage metrics show cumulative count of Article Views (full-text article views including HTML views, PDF and ePub downloads, according to the available data) and Abstracts Views on Vision4Press platform.
Data correspond to usage on the plateform after 2015. The current usage metrics is available 48-96 hours after online publication and is updated daily on week days.
Initial download of the metrics may take a while.