Fig. 6.
Download original image
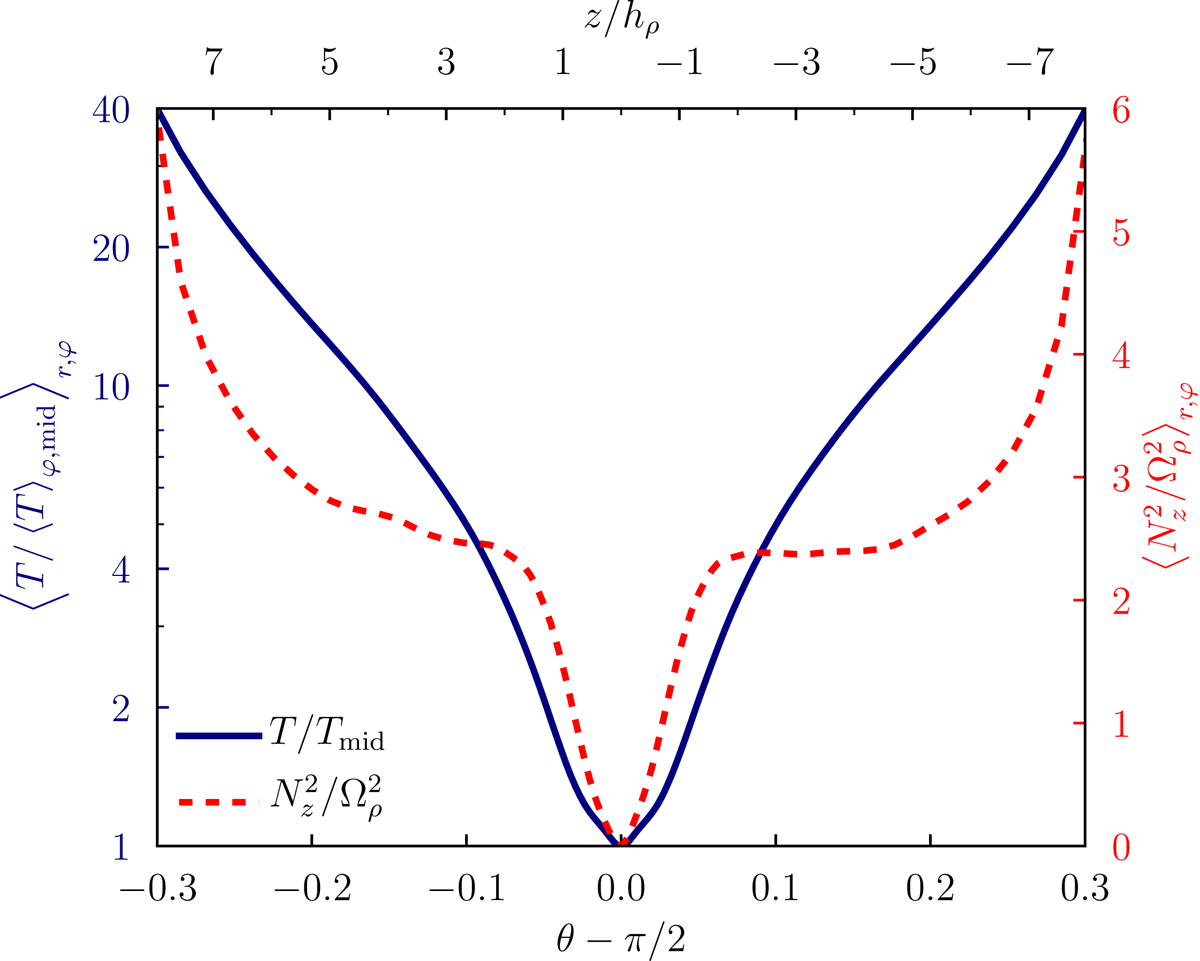
Thermal stratification of the disk. The solid blue line (left axis) shows the gas temperature relative to its midplane value. The dashed red line (right axis) shows the squared buoyancy frequency (Eq. (7)) relative to the local squared orbital frequency. Both profiles were averaged azimuthally, over r/rin ∈ [2,8] and over time from 200tin to 400tin.
Current usage metrics show cumulative count of Article Views (full-text article views including HTML views, PDF and ePub downloads, according to the available data) and Abstracts Views on Vision4Press platform.
Data correspond to usage on the plateform after 2015. The current usage metrics is available 48-96 hours after online publication and is updated daily on week days.
Initial download of the metrics may take a while.