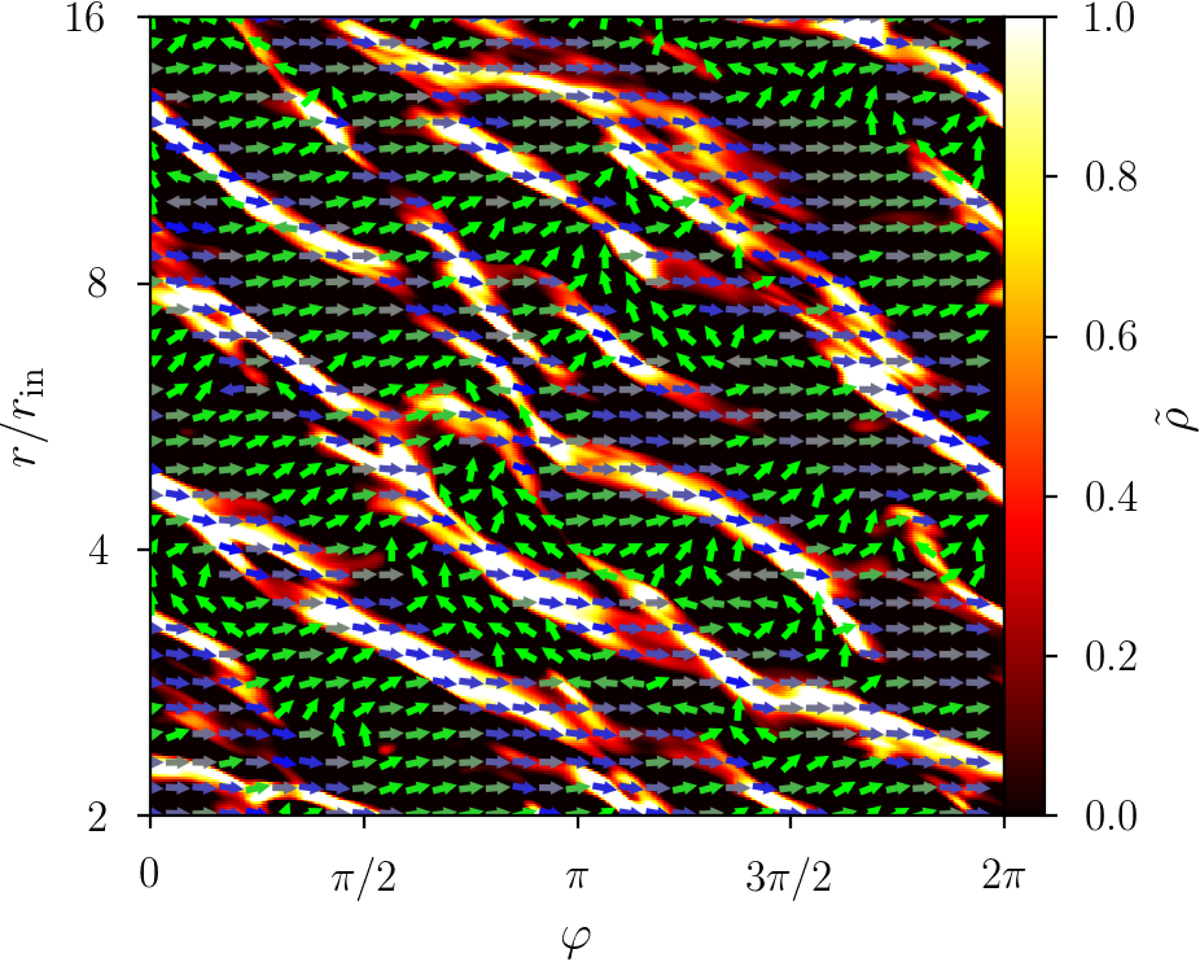
Fig. 4.
Download original image
Equatorial slice in run M3T10R10 at time 400tin, zoomed in on the radial interval r/rin ∈ [2,16]. The color map shows the relative density fluctuations as defined by Eq. (6) while the arrows show the orientation of the magnetic field sampled in the midplane, colored in blue when inward (Br < 0) or green when outward (Br > 0).
Current usage metrics show cumulative count of Article Views (full-text article views including HTML views, PDF and ePub downloads, according to the available data) and Abstracts Views on Vision4Press platform.
Data correspond to usage on the plateform after 2015. The current usage metrics is available 48-96 hours after online publication and is updated daily on week days.
Initial download of the metrics may take a while.