Open Access
Fig. 5.
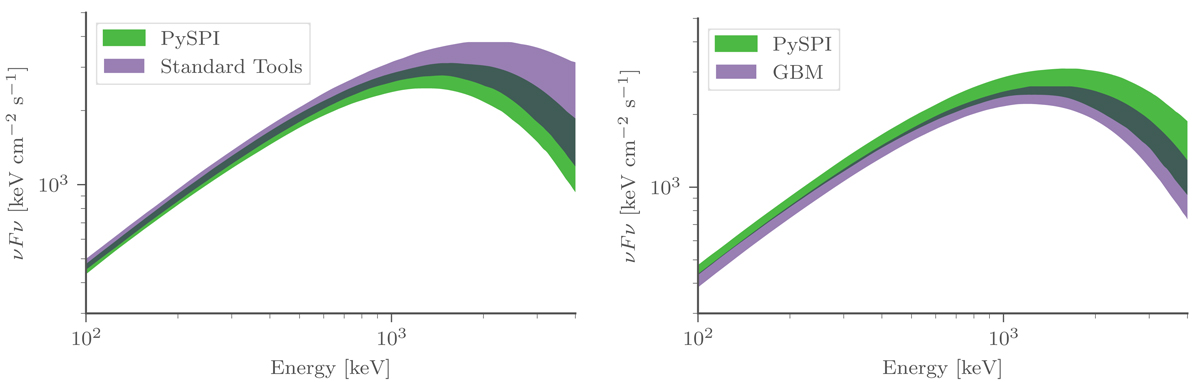
Download original image
Model posterior plots (95% confidence region) for the results with the Band function model and the data for GRB120711A. Left panel: results for the PySPI fit compared to the fit using OSA and right panel: PySPI fit compared to the GBM fit.
Current usage metrics show cumulative count of Article Views (full-text article views including HTML views, PDF and ePub downloads, according to the available data) and Abstracts Views on Vision4Press platform.
Data correspond to usage on the plateform after 2015. The current usage metrics is available 48-96 hours after online publication and is updated daily on week days.
Initial download of the metrics may take a while.