Open Access
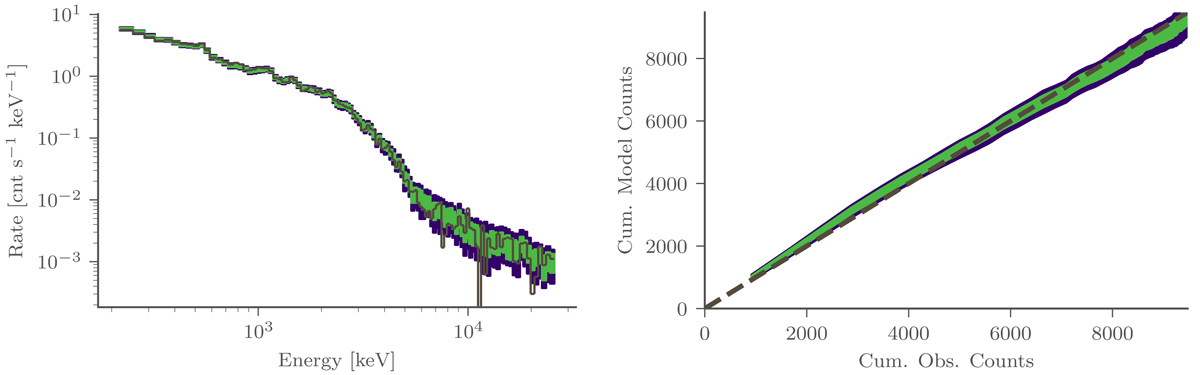
Fig. B.2.
Download original image
PPC (left) and QQ (right) plot for the GBM detector b0. The green and purple shaded area are the one- and two-sigma contours. The dark yellow curve has the same signification as in Fig. B.1. for the two plots.
Current usage metrics show cumulative count of Article Views (full-text article views including HTML views, PDF and ePub downloads, according to the available data) and Abstracts Views on Vision4Press platform.
Data correspond to usage on the plateform after 2015. The current usage metrics is available 48-96 hours after online publication and is updated daily on week days.
Initial download of the metrics may take a while.