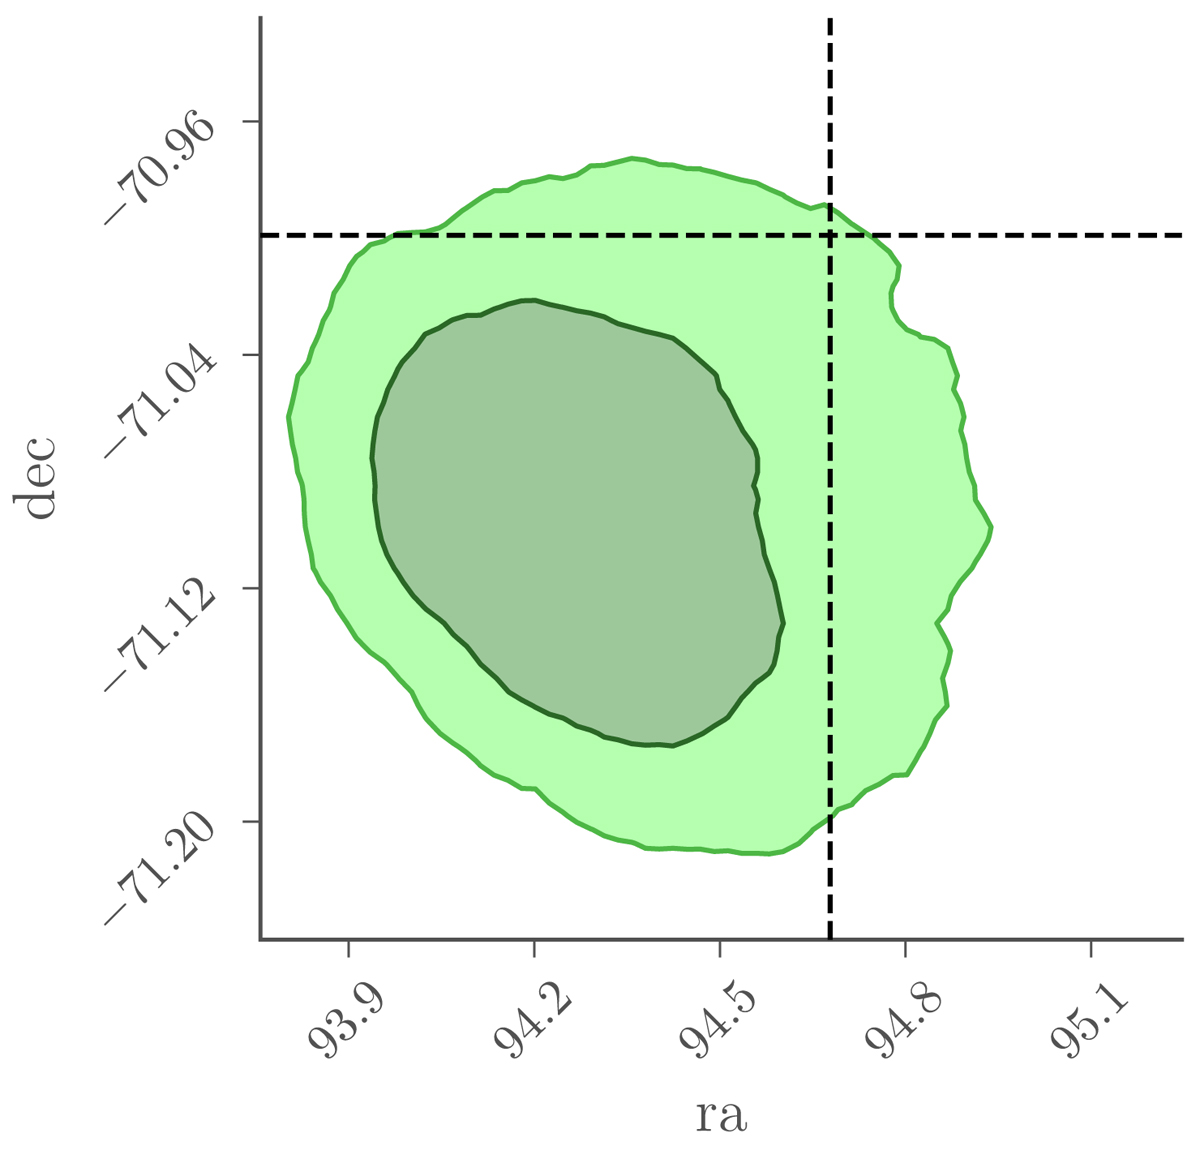
Fig. A.1.
Download original image
Localisation of GRB120711A with PySPI. Contours show the statistical only 1- and 2-sigma credible regions. We estimate an additional systematic error of ≈ 0.5 degrees because that is the resolution of the grid points in the response simulation. The dashed lines mark the position observed by Swift/XRT (Beardmore & Evans 2012).
Current usage metrics show cumulative count of Article Views (full-text article views including HTML views, PDF and ePub downloads, according to the available data) and Abstracts Views on Vision4Press platform.
Data correspond to usage on the plateform after 2015. The current usage metrics is available 48-96 hours after online publication and is updated daily on week days.
Initial download of the metrics may take a while.