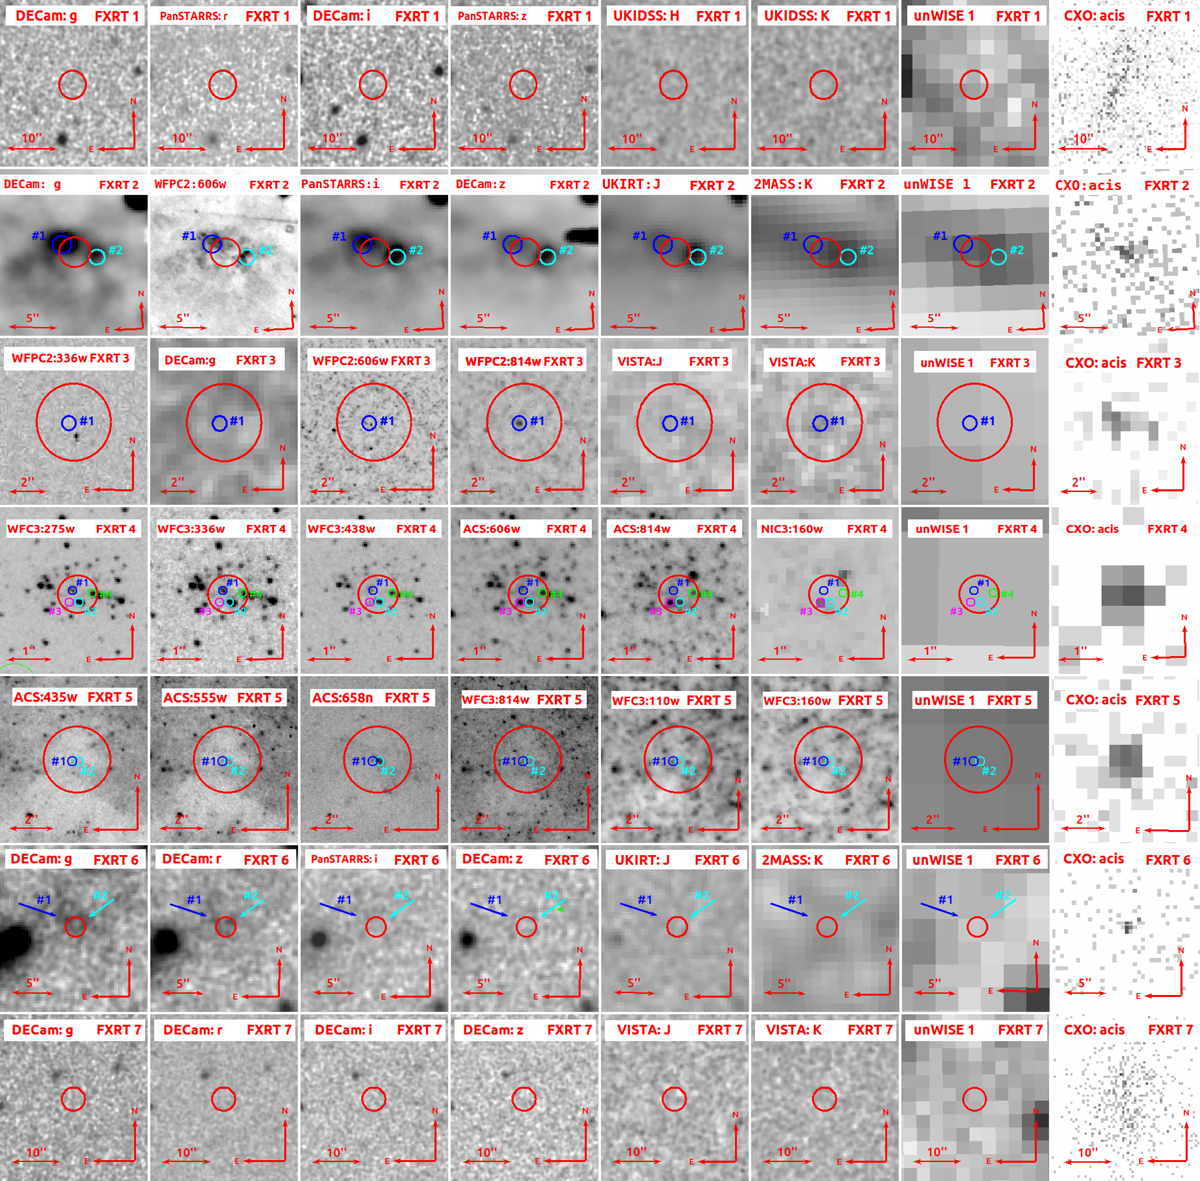
Fig. 7.
Download original image
Archival optical, NIR, MIR, and X-ray images of extragalactic FXRT candidates; the telescope or instrument plus filter and FXRT ID name are shown in the upper-left and upper-right corners, respectively. Each cutout is centered on the X-ray position, and red circles denote 3σChandra errors in the source localization. Columns 1–4: optical band (DECam, Pan-STARRS, and HST) images. Columns 5 and 6: NIR J or H and K (UKIRT or VISTA) images. Column 7: 3.4μm (unWISE) images. Column 8: X-ray Chandra (ACIS) 0.5–7 keV images.
Current usage metrics show cumulative count of Article Views (full-text article views including HTML views, PDF and ePub downloads, according to the available data) and Abstracts Views on Vision4Press platform.
Data correspond to usage on the plateform after 2015. The current usage metrics is available 48-96 hours after online publication and is updated daily on week days.
Initial download of the metrics may take a while.