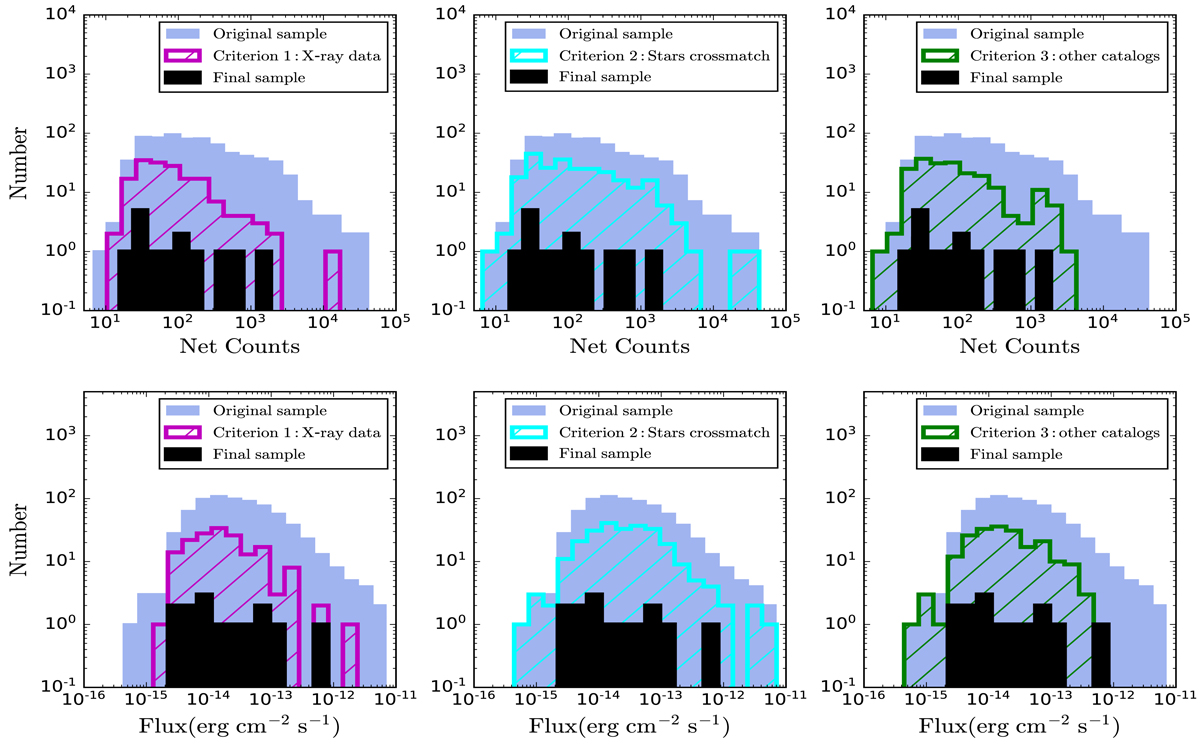
Fig. 5.
Download original image
Comparison of 0.5–7.0 keV net-count (top panels) and flux (bottom panels; 0.5–7.0 keV) distributions for the initial (filled blue histograms) and final (filled black histograms) samples, as well as subsets covered by various purity criteria (colored, unfilled histograms) for the sample. Net counts and fluxes are provided by the CSC2.
Current usage metrics show cumulative count of Article Views (full-text article views including HTML views, PDF and ePub downloads, according to the available data) and Abstracts Views on Vision4Press platform.
Data correspond to usage on the plateform after 2015. The current usage metrics is available 48-96 hours after online publication and is updated daily on week days.
Initial download of the metrics may take a while.