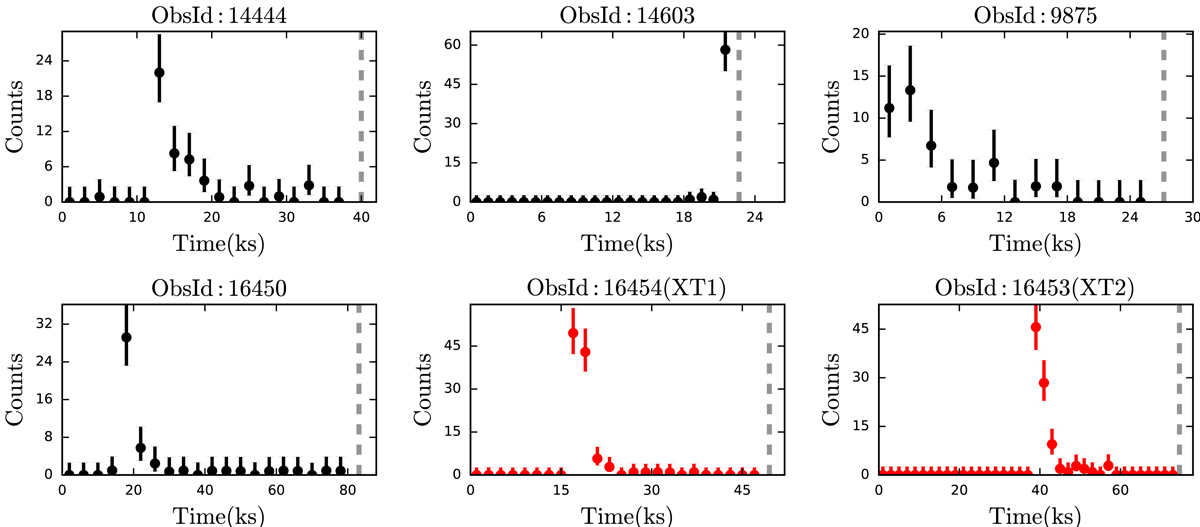
Fig. 3.
Download original image
X-ray light curves extracted as described in Sect. 2.3 and identified via our algorithm described in Sect. 2.1. The four light curves in black denote randomly selected sources from initial FXRTs found in the CSC2. For comparison, we show in red the FXRT sources CDF-S XT1 and CDF-S XT2. For visualization purposes, background-subtracted light curves are presented with either 1 ks or 2 ks bins with 1σ errors. In all cases, the vertical dashed gray line represents the end of the observation.
Current usage metrics show cumulative count of Article Views (full-text article views including HTML views, PDF and ePub downloads, according to the available data) and Abstracts Views on Vision4Press platform.
Data correspond to usage on the plateform after 2015. The current usage metrics is available 48-96 hours after online publication and is updated daily on week days.
Initial download of the metrics may take a while.