Fig. B.1.
Download original image
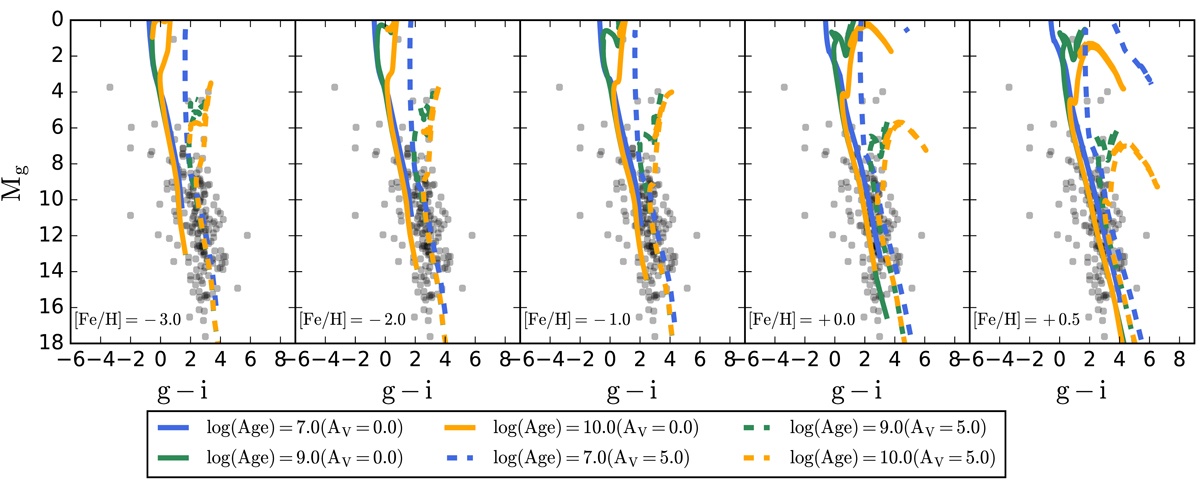
Color-magnitude diagrams, considering only Pan-STARRS and DECam counterparts (gray background points) of X-ray sources classified as stars according to Criterion 2 (see Sect. 2.5.2). As a comparison, we overplot isochrones with different ages (from log(Age) = 7.0 − 10.0) taken from the MIST package (Dotter 2016; Choi et al. 2016). Each panel represents different metallicities (from [Fe/H] = − 3.0 to +0.5), while solid and dashed lines are isochrones with attenuations of AV = 0.0 and 5.0, respectively.
Current usage metrics show cumulative count of Article Views (full-text article views including HTML views, PDF and ePub downloads, according to the available data) and Abstracts Views on Vision4Press platform.
Data correspond to usage on the plateform after 2015. The current usage metrics is available 48-96 hours after online publication and is updated daily on week days.
Initial download of the metrics may take a while.