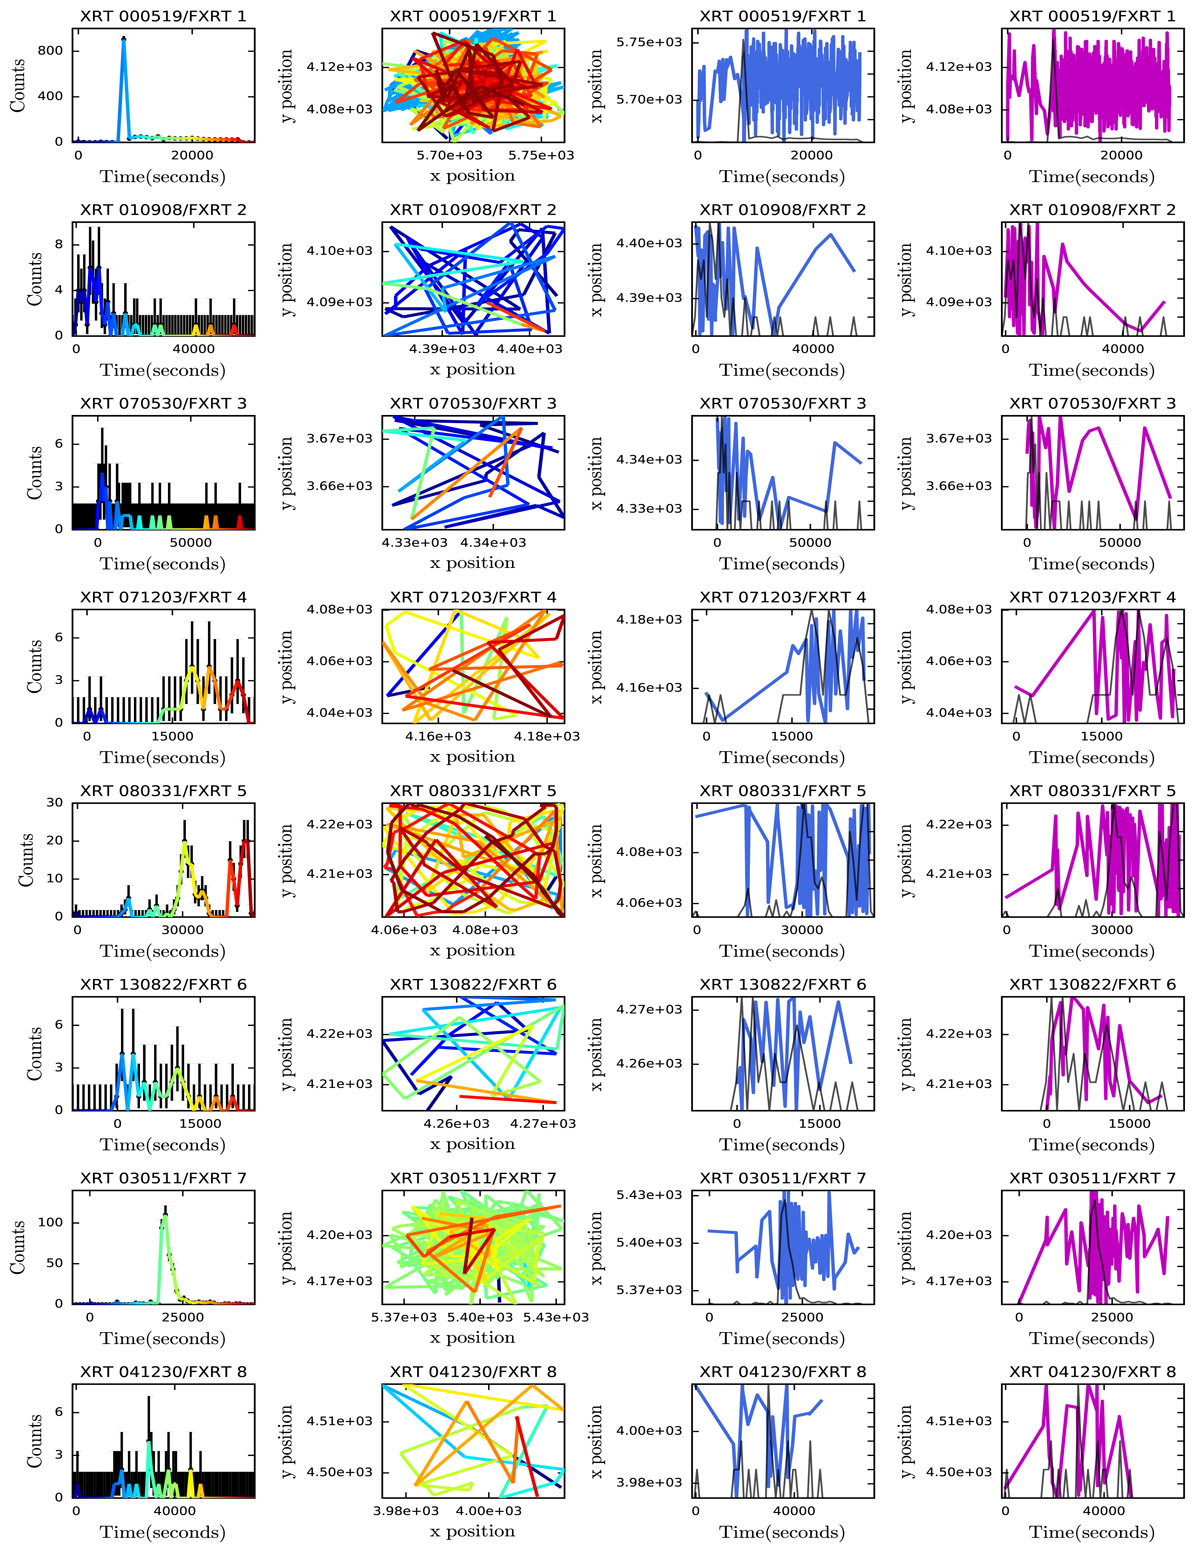
Fig. A.2.
Download original image
Lissajous dither pattern in detector coordinates. First column: FXRT 0.5–7.0 keV light curves in count units, color-coded as a function of time. Second column:Chandra 0.5–7.0 keV images in detector coordinates, with the same color-coding as a function of time, demonstrating the temporal movement of the source on the detector in response to the Lissajous dither pattern. A flaring pixel would appear as a point on these plots. Third and fourth columns: x (blue) and y (purple) detector coordinates, respectively, of the detected X-ray photons from the FXRTs as a function of time, with the candidate light curves superimposed as solid dark gray lines.
Current usage metrics show cumulative count of Article Views (full-text article views including HTML views, PDF and ePub downloads, according to the available data) and Abstracts Views on Vision4Press platform.
Data correspond to usage on the plateform after 2015. The current usage metrics is available 48-96 hours after online publication and is updated daily on week days.
Initial download of the metrics may take a while.