Fig. 19.
Download original image
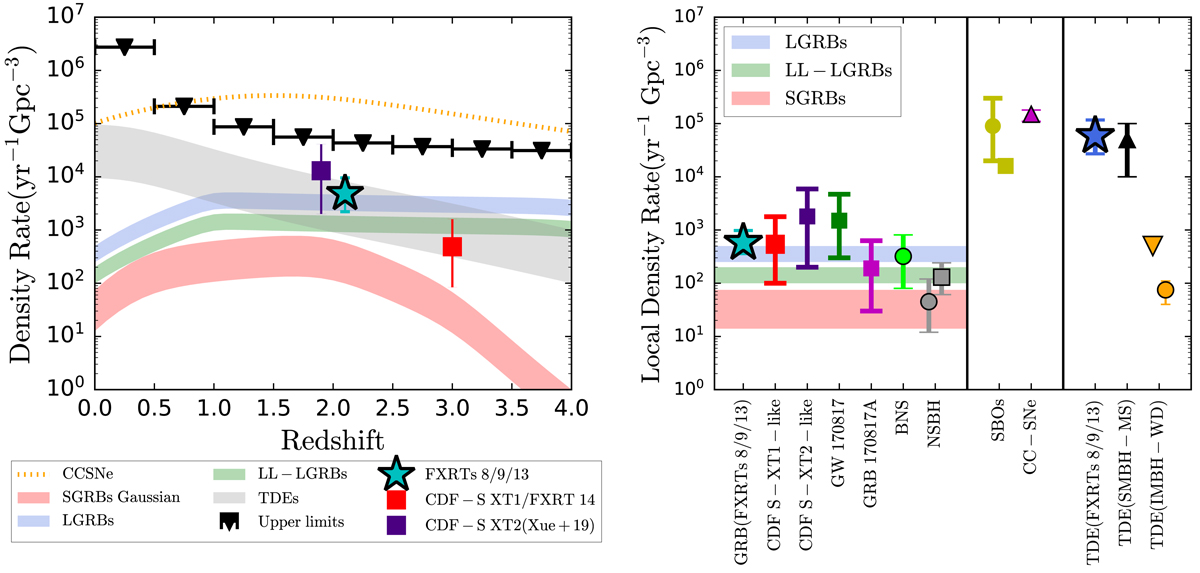
Density rate as a function of redshift for several known transient classes compared to our sample. Left panel: density rate as a function of redshift for FXRT 8/9/13 (cyan star) and CDF-S XT1/FXRT 14 (red square), and upper limits (black triangle) for FXRTs without measured redshifts. We also show the density rate of CDF-S XT2 (purple square; Xue et al. 2019), CC-SNe (dotted orange line; Madau & Dickinson 2014), the redshift-dependent intrinsic event rate densities of LGRBs (blue-filled region; taken from Sun et al. 2015 and Wanderman & Piran 2010, normalized to the local universe value and corrected for jet-aperture as ρ0, LGRBs ∼ 250–500 yr−1 Gpc−3), LL-LGRBs (green-filled region; taken from Zhang 2018, normalized to the local universe value and corrected for jet-aperture as ρ0, LGRBs ∼ 100–200 yr−1 Gpc−3), SGRBs considering a merger delay Gaussian model (red-filled region; taken from Sun et al. 2015 and Wanderman & Piran 2015, normalized to the local universe value and corrected for jet-aperture as ρ0, SGRBs ∼ 13–75 yr−1 Gpc−3), and TDEs (gray-filled region, taken from Sun et al. 2015, normalized to the local universe as ρ0, TDEs ∼ 104–105 yr−1 Gpc−3 at luminosities ∼1042–1044 erg s−1). Right panel: local density rate for FXRT 8/9/13 considering they are related to GRBs (cyan star), TDEs (blue star), or FXRT 14/CDF-S XT1 (red square) (see Sect. 6.3). As a comparison, we also plot the local event rate of CDF-S XT2-like events (purple square; Xue et al. 2019), GW 170817 (green square; Abbott et al. 2017b), and GRB 170817A (magenta square; Zhang et al. 2018), as well other kinds of transients, such as the new SBO candidate in XMM-Newton data (yellow square and circle; Xu et al. 2008; Novara et al. 2020), the TDE rate of SMBH–MS TDEs (black triangle; Sun et al. 2015) and the IMBH–WD TDE rate (orange triangle and circle; Malyali et al. 2019; Tanikawa et al. 2021), the CC-SN rate (magenta triangle), the merger rate of BNS systems (light green circle; Abbott et al. 2021c), and the merger rate of neutron star and BH systems (gray circles; Abbott et al. 2021b). The local event rate of LGRBs, LL-LGRBs, and SGRBs are plotted (blue, green, and red horizontal shaded regions, corrected for the jet aperture factor; Zhang 2018).
Current usage metrics show cumulative count of Article Views (full-text article views including HTML views, PDF and ePub downloads, according to the available data) and Abstracts Views on Vision4Press platform.
Data correspond to usage on the plateform after 2015. The current usage metrics is available 48-96 hours after online publication and is updated daily on week days.
Initial download of the metrics may take a while.