Fig. 18.
Download original image
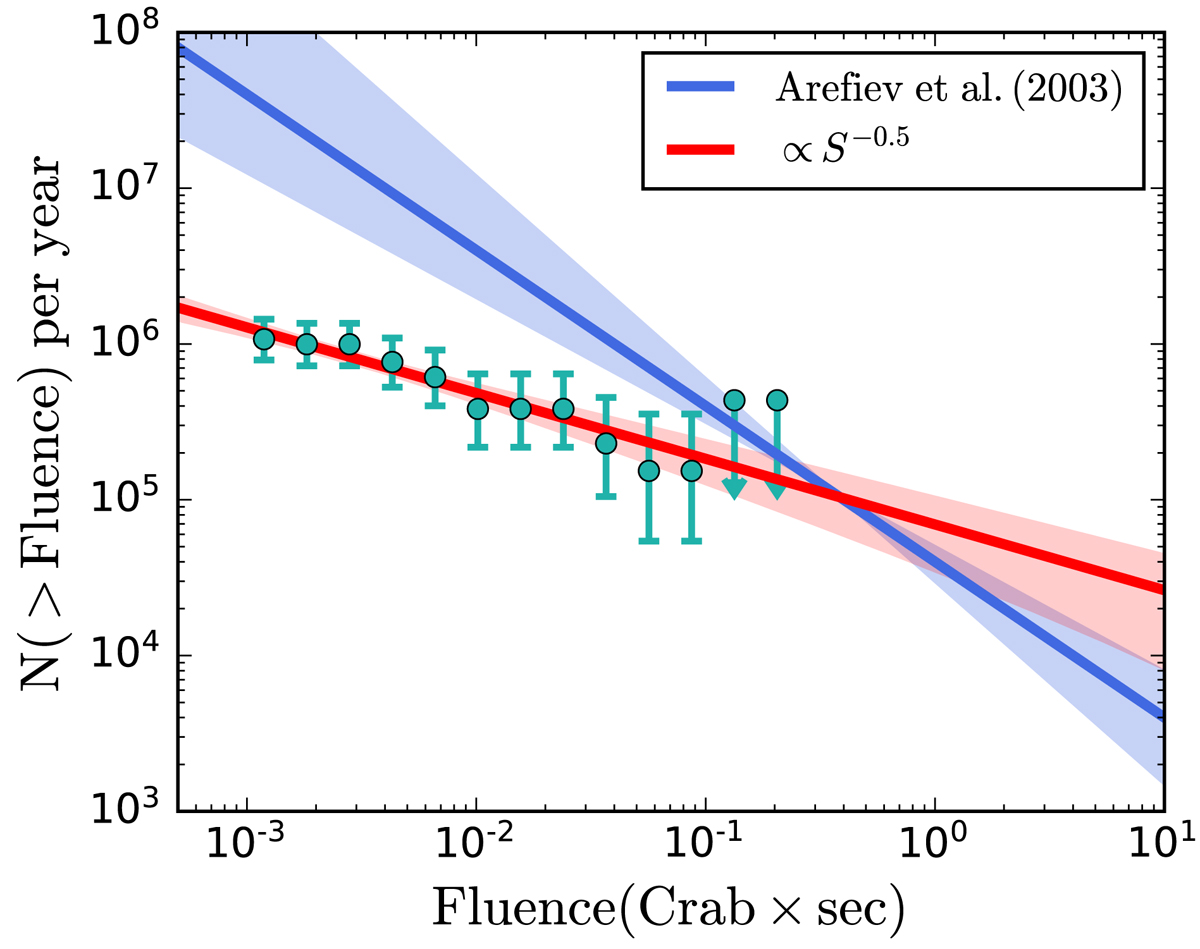
Observed cumulative log 𝒩–log S distribution of our sample of FXRTs as a function of fluence (in units of Crab† × second). Also shown are two PL models, N(> S)∝S−γ, with slopes γ = 0.5 (red line) and 1.0 (blue line). The γ = 0.5 line denotes the best fit to the CSC2 sample. The γ = 1 line represents the best fit and 1σ error of Arefiev et al. (2003) based on bright FXRTs. The brightest sources in our sample appear to be consistent with this bright-end extrapolation, although our fainter sources fall ∼1 dex below, implying a break. For comparison with Arefiev et al. (2003), we convert the fluence to 2–10 keV. †A Crab is a standard astrophotometric unit for measurement of the intensity of celestial X-ray sources.
Current usage metrics show cumulative count of Article Views (full-text article views including HTML views, PDF and ePub downloads, according to the available data) and Abstracts Views on Vision4Press platform.
Data correspond to usage on the plateform after 2015. The current usage metrics is available 48-96 hours after online publication and is updated daily on week days.
Initial download of the metrics may take a while.