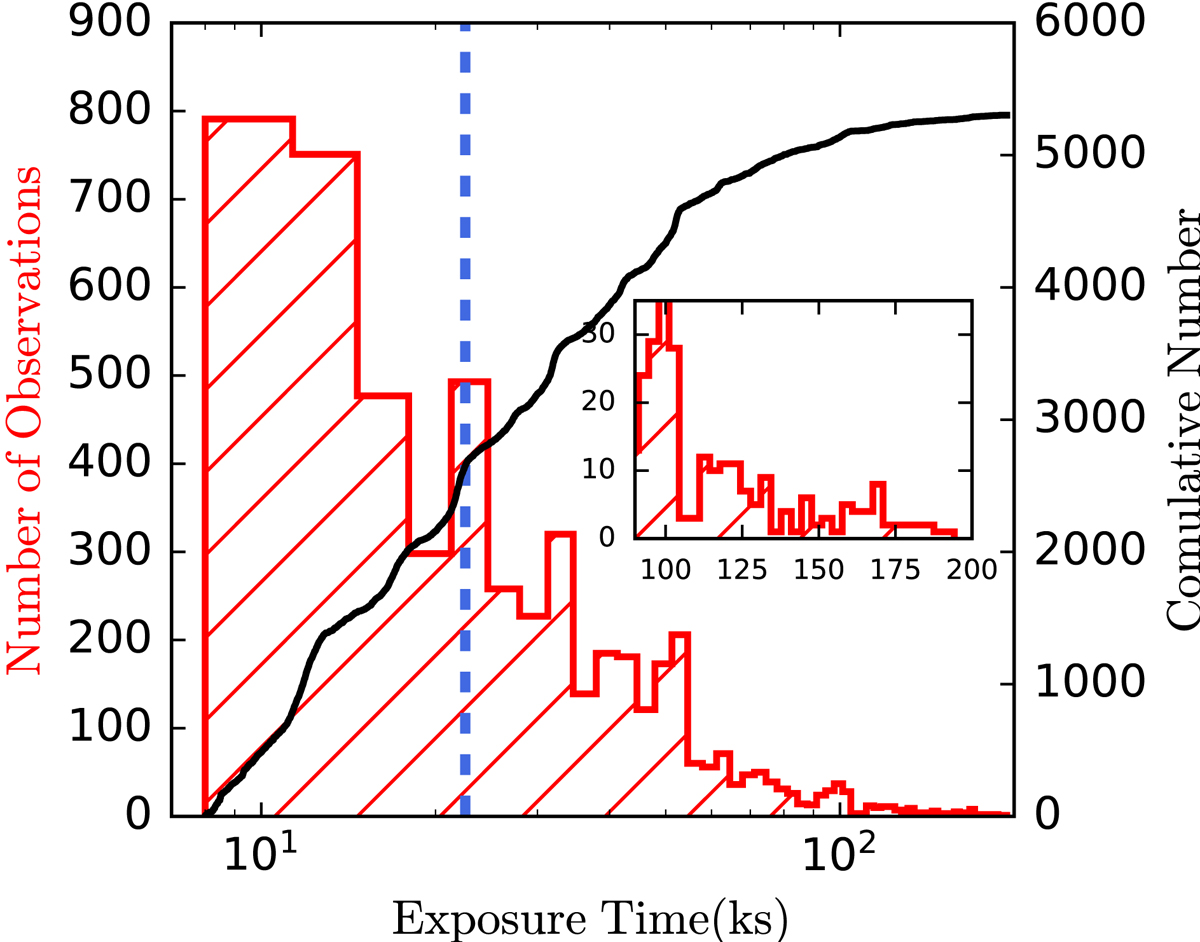
Fig. 2.
Download original image
Histogram (red; left Y axis) and cumulative (black; right Y axis) distributions of the exposure time of the 5303 Chandra observations used in this work. The inset provides a zoomed-in view to show the high-exposure-time tail of the distribution. The vertical dashed blue line indicates the median exposure time (=32 ks) of the total sample. We adopt an exposure time of 8 ks as a lower bound due to the strongly decreasing probability of distinguishing FXRTs in short exposures.
Current usage metrics show cumulative count of Article Views (full-text article views including HTML views, PDF and ePub downloads, according to the available data) and Abstracts Views on Vision4Press platform.
Data correspond to usage on the plateform after 2015. The current usage metrics is available 48-96 hours after online publication and is updated daily on week days.
Initial download of the metrics may take a while.