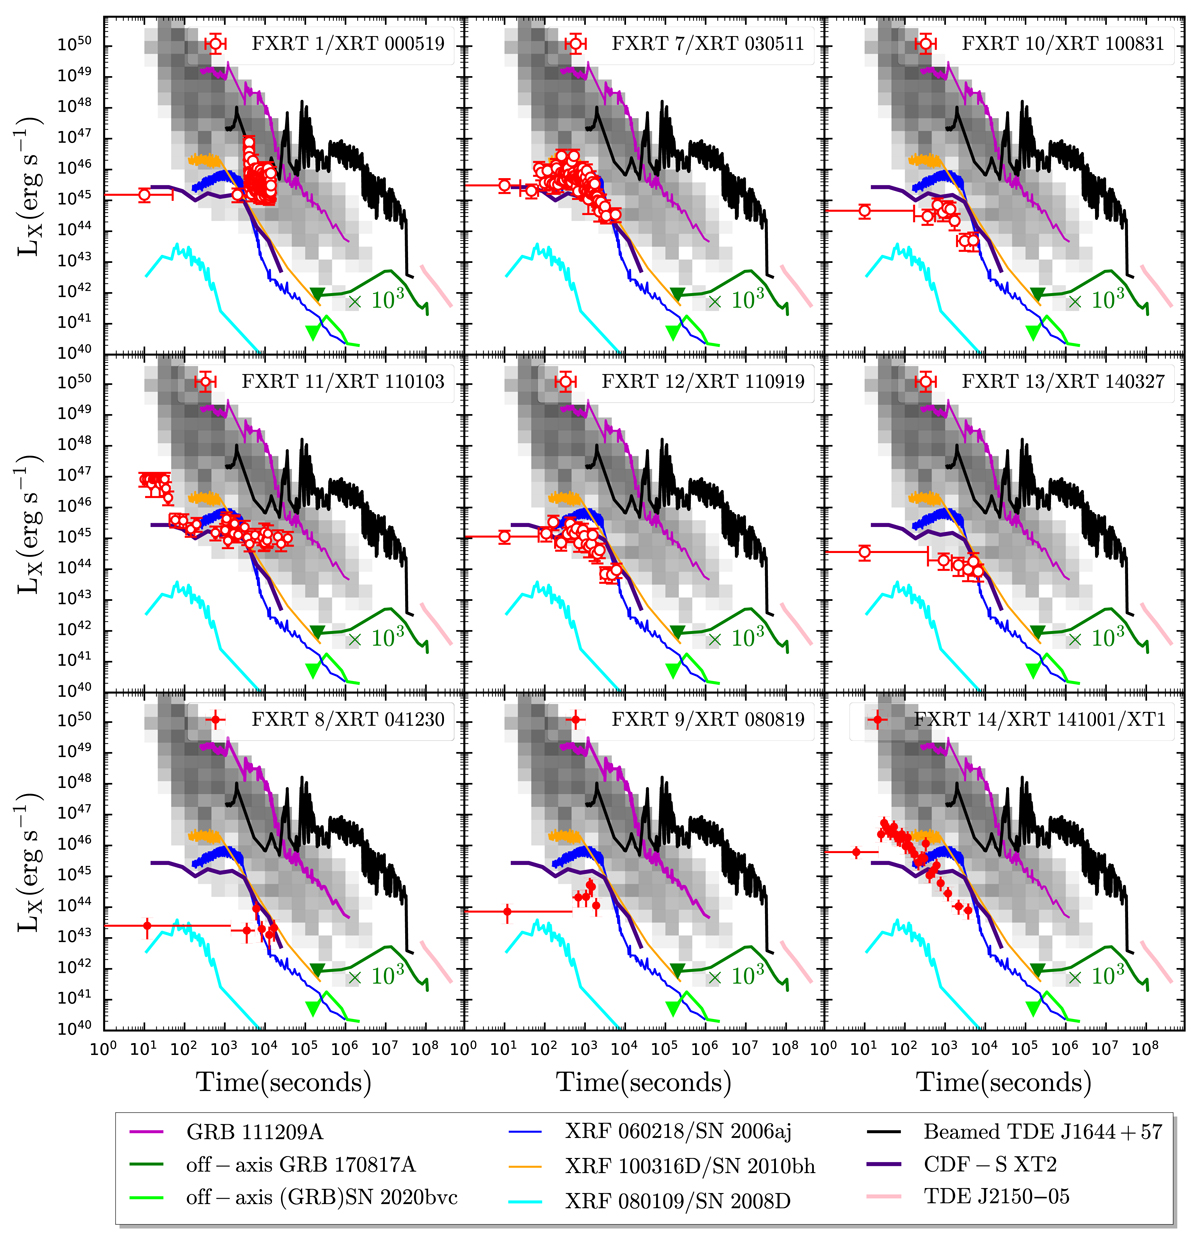
Fig. 17.
Download original image
0.3–10 keV light curves of the nine CSC2 FXRTs in luminosity units (as in Fig. 16, 0.3–10 keV light curves were converted from 0.5–7 keV ones). The X-ray afterglow light curves of 64 LGRBs plus 32 SGRBs (taken from Bernardini et al. 2012; Lü et al. 2015) are shown as a 2D histogram, as are the X-ray afterglows of GRB 170817A (off-axis SGRB, solid dark green line; Nynka et al. 2018; D’Avanzo et al. 2018; Troja et al. 2020, 2022), SN 2020bvc (the first off-axis LGRB candidate, solid light green line; Izzo et al. 2020), and the ultra-long duration GRB 111209A (solid magenta line, z = 0.677; Levan et al. 2014). Additionally, several individual transients are overplotted: the low-luminosity supernova SBO XRF 080109/SN 2008D (solid cyan lines, 27 Mpc;), XRF 060218/SN 2006aj (solid blue lines, 145 Mpc;), XRF 100316D/SN 2010bh (solid orange lines, 263 Mpc; Barniol Duran et al. 2015; Starling et al. 2011; Modjaz et al. 2009; Evans et al. 2007, 2009; Soderberg et al. 2008; Campana et al. 2006), the relativistically beamed TDE Swift J1644+57 (solid black lines, z = 0.3543; Bloom et al. 2011; Levan et al. 2011), the non-beamed TDE J2150-05 (solid pink line, z = 0.055; Lin et al. 2018), and CDF-S XT2 (solid indigo lines; Xue et al. 2019). For FXRTs 1, 7, 10, 11, 12, and 13 (open symbols), we assume z = 1.0, we adopt zphoto = 2.23 for FXRT 14 from Bauer et al. (2017), and for FXRTs 8 and 9 we consider the values from Table 8.
Current usage metrics show cumulative count of Article Views (full-text article views including HTML views, PDF and ePub downloads, according to the available data) and Abstracts Views on Vision4Press platform.
Data correspond to usage on the plateform after 2015. The current usage metrics is available 48-96 hours after online publication and is updated daily on week days.
Initial download of the metrics may take a while.