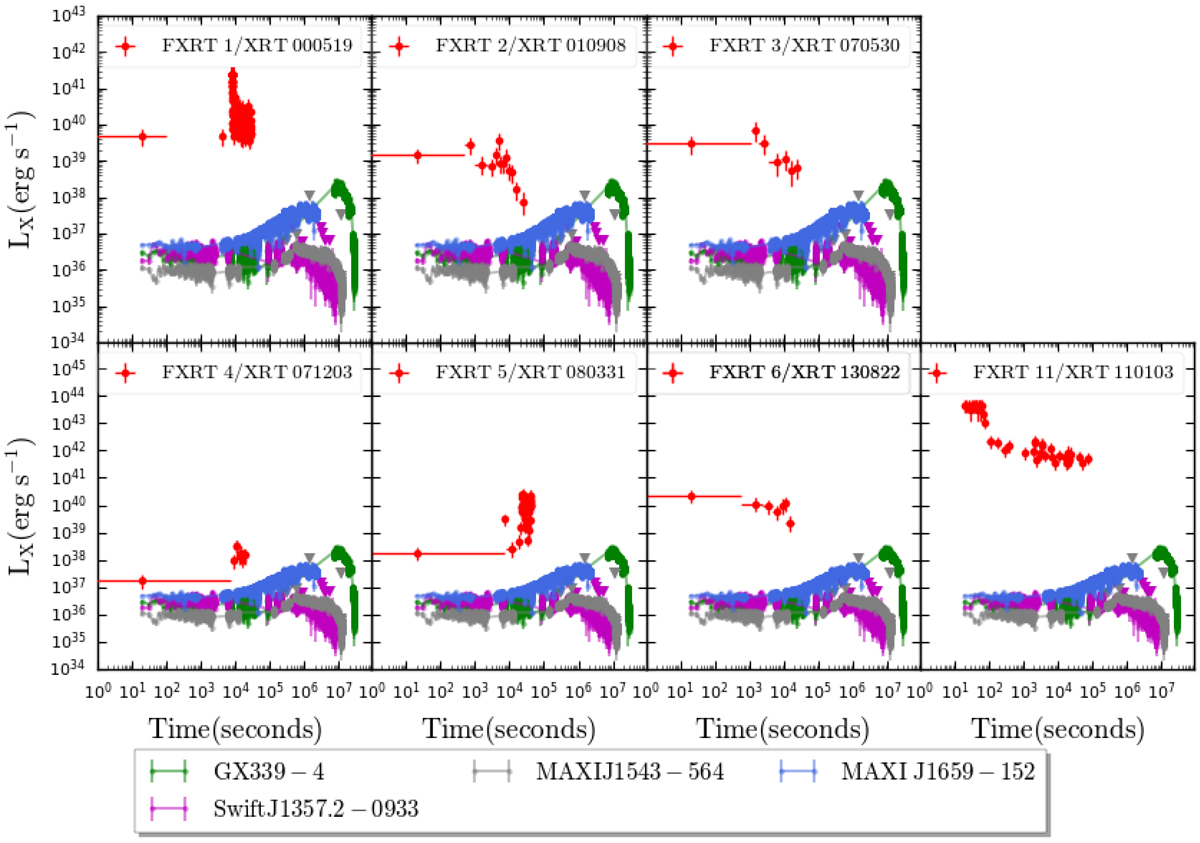
Fig. 16.
Download original image
0.3–10 keV light curves of the five local CSC2 FXRTs, plus FXRTs 1 and 11, in luminosity units. The 0.3–10 keV light curves are obtained by multiplying the 0.3–7 keV light curves by the factor derived from extrapolating the best-fit PO model flux to the 0.5–7.0 keV spectrum to the 0.3–10 keV band and correcting it for the effects of Galactic plus intrinsic absorption. For comparison, we overplot flaring episodes for several individual well-known Galactic XRBs: GX339-4 (9 kpc, green line; Heida et al. 2017), Swift J1357.2−0933 (8 kpc, magenta line; Mata Sánchez et al. 2015), MAXI J1543−564 (5 kpc, gray line; Stiele et al. 2012), and MAXI J1659−152 (6 kpc, blue line; Jonker et al. 2012b). The light curves of the comparison sources are taken from the 2SXPS catalog (Evans et al. 2020b).
Current usage metrics show cumulative count of Article Views (full-text article views including HTML views, PDF and ePub downloads, according to the available data) and Abstracts Views on Vision4Press platform.
Data correspond to usage on the plateform after 2015. The current usage metrics is available 48-96 hours after online publication and is updated daily on week days.
Initial download of the metrics may take a while.