Fig. 15.
Download original image
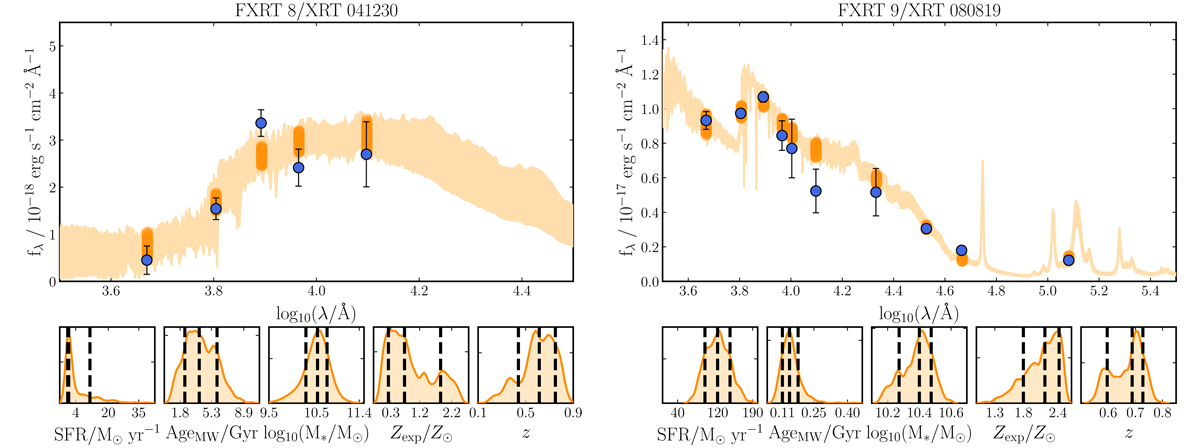
Best fitting SED models obtained using the BAGPIPES package (Carnall et al. 2018) for FXRTs 8 (left panels) and 9 (right panels). Top panels: 16th to 84th percentile range for the posterior spectrum and photometry (shaded orange). The used photometric data and their uncertainties are given by the blue markers. Bottom panels: posterior distribution for the five fitted parameters (SFR, age, galaxy stellar mass, metallicity, and redshift). The 16th, 50th, and 84th percentile posterior values are indicated by the vertical dashed black lines.
Current usage metrics show cumulative count of Article Views (full-text article views including HTML views, PDF and ePub downloads, according to the available data) and Abstracts Views on Vision4Press platform.
Data correspond to usage on the plateform after 2015. The current usage metrics is available 48-96 hours after online publication and is updated daily on week days.
Initial download of the metrics may take a while.