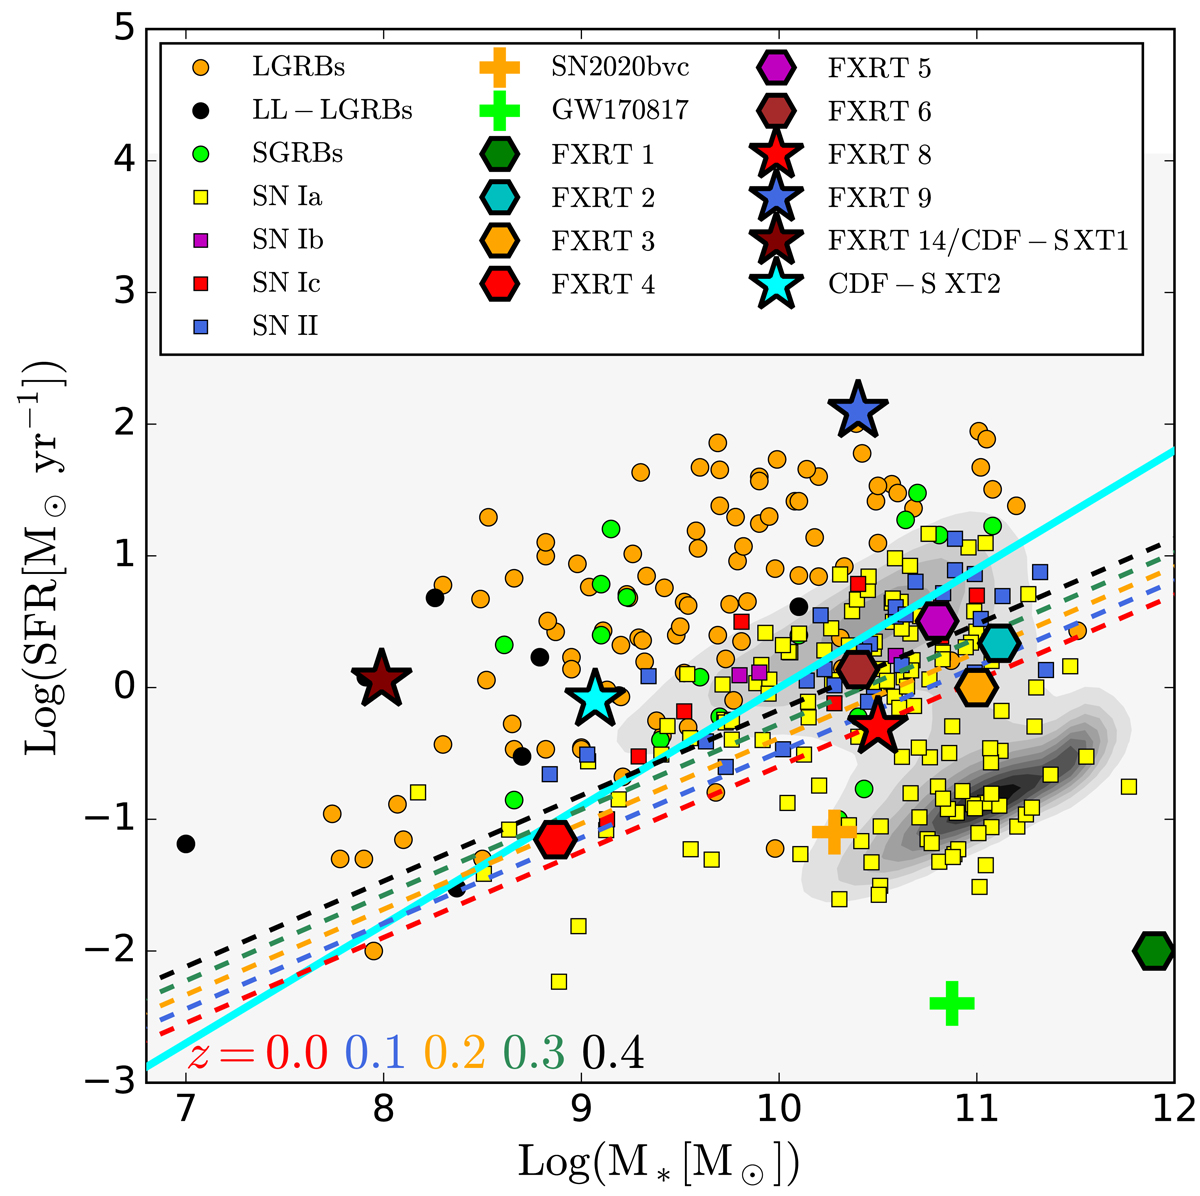
Fig. 13.
Download original image
Comparison of the stellar mass (M*) and SFR of host galaxies of different types of transients: nearby (colored hexagons) and distant (colored stars) FXRT candidates, LGRBs and SGRBs (Li et al. 2016), low-luminosity LGRBs (LL-LGRBs; GRB 980425, GRB 020903, GRB 030329, GRB 031203, GRB 050826, GRB 060218, and GRB 171205A; Christensen et al. 2008; Michałowski et al. 2014; Levesque 2014; Krühler et al. 2017; Wiersema et al. 2007; Wang et al. 2018; Arabsalmani et al. 2019), GW 170817 (Im et al. 2017), SN 2020bvc (Chang et al. 2015; Izzo et al. 2020; Ho et al. 2020), FXRT 14/CDF-S XT1 (Bauer et al. 2017) and CDF-S XT2 (Xue et al. 2019), and supernovae events (Types Ia, Ib, Ic, and II; Tsvetkov & Bartunov 1993; Galbany et al. 2014). The solid cyan line shows the best-fit local galaxy main sequence relation from Peng et al. (2010). The gray background contours are the galaxy distribution from the SDSS (data taken from Brinchmann et al. 2004). The dashed colored lines are the boundaries separating the star-forming and quiescent galaxies and its evolution with redshift (at z = 0.0, 0.1, 0.2, 0.3, and 0.4, from bottom to top; Moustakas et al. 2013).
Current usage metrics show cumulative count of Article Views (full-text article views including HTML views, PDF and ePub downloads, according to the available data) and Abstracts Views on Vision4Press platform.
Data correspond to usage on the plateform after 2015. The current usage metrics is available 48-96 hours after online publication and is updated daily on week days.
Initial download of the metrics may take a while.