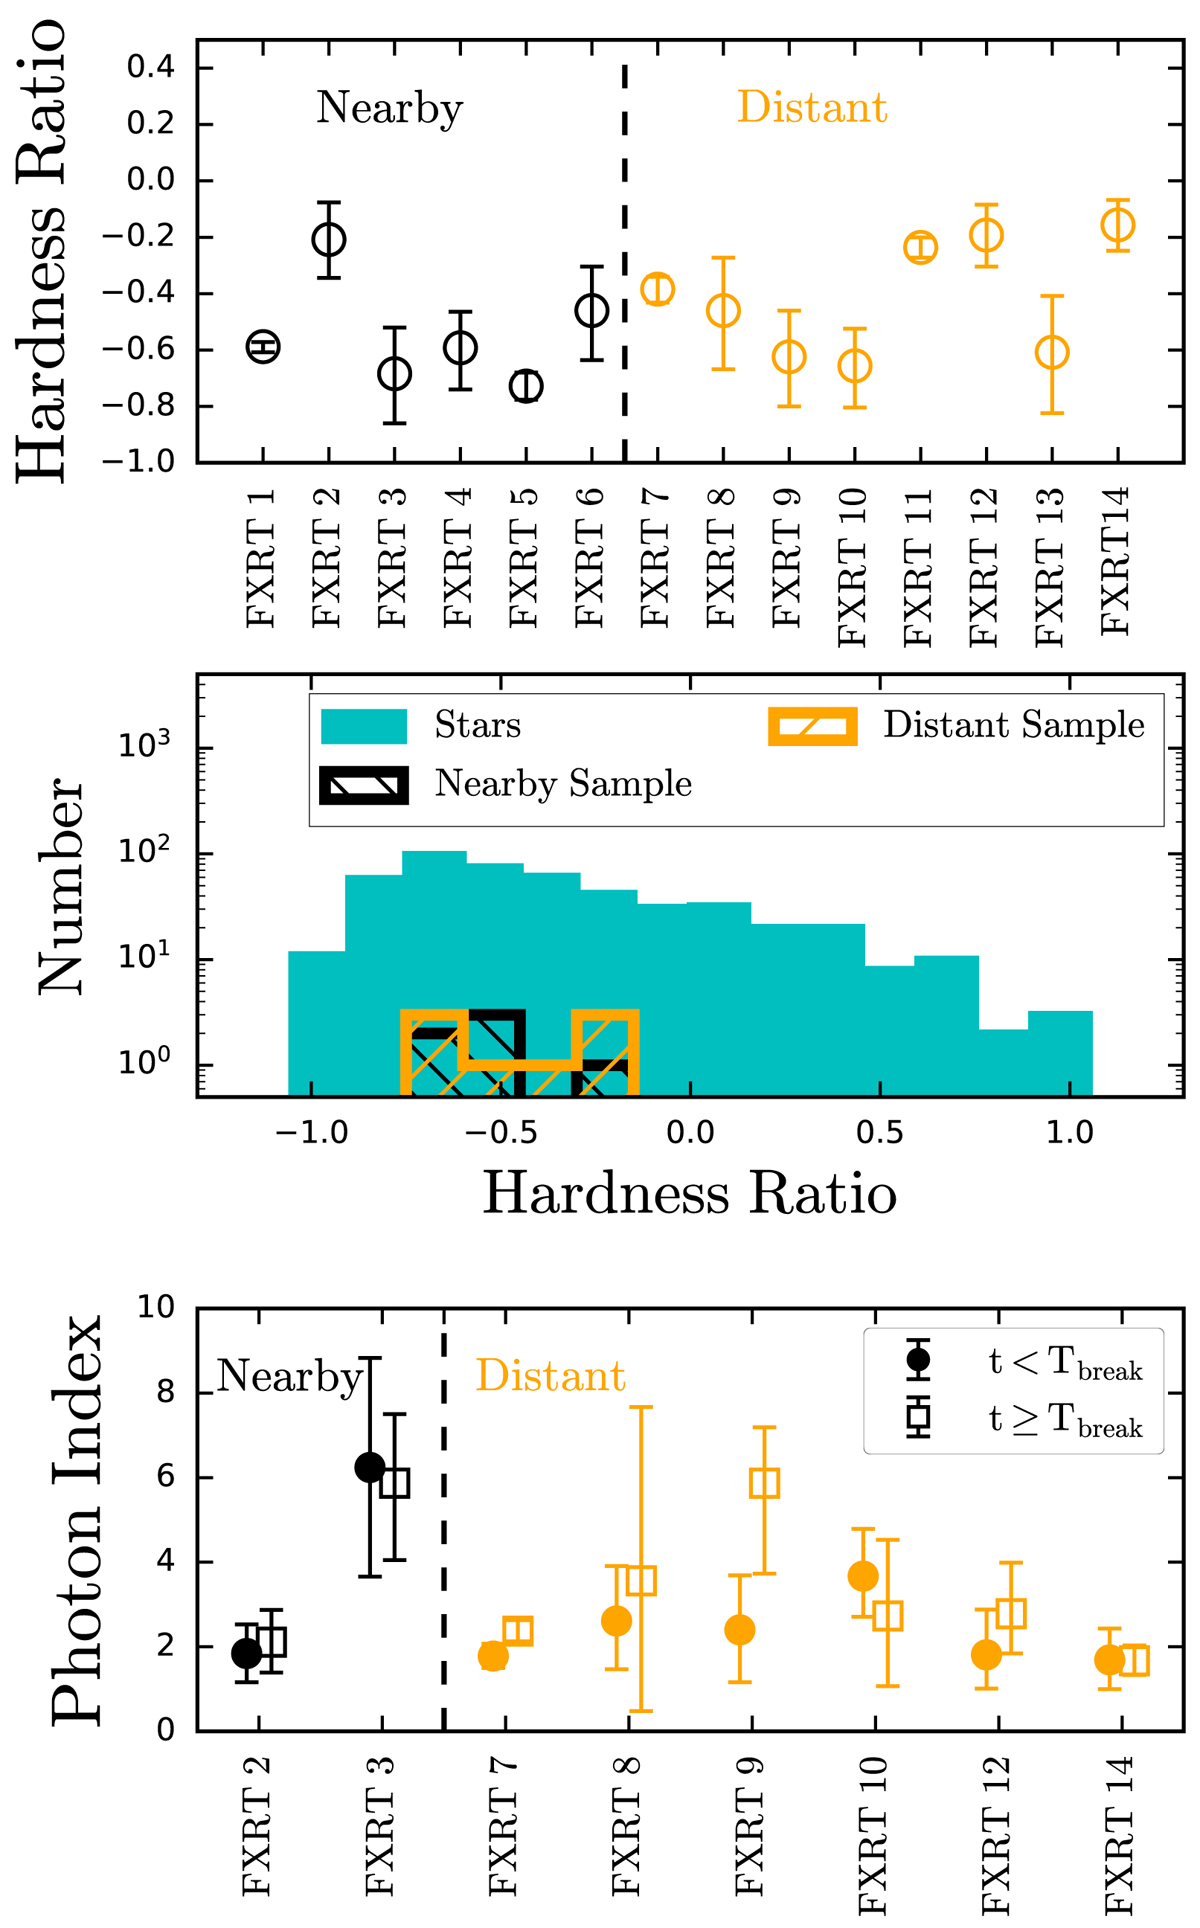
Fig. 12.
Download original image
Photon index and HR distribution of our selected transient candidates. Top panel: HR of each FXRT candidate (using the Bayesian BEHR code; Park et al. 2006). Middle panel: HR distributions of our final samples of nearby (hashed black histogram) and distant (hashed orange histogram) FXRTs, compared to the XRTs classified as “stars” according to Criterion 2 using Gaia (filled cyan histogram). Bottom panel: photon indices for FXRT candidates where the light curve was best fit by a BPL model, before (filled circles) and after (open squares) the break time (Tbreak) taken from Table 4. In all cases, errors bars are at the 90% confidence level.
Current usage metrics show cumulative count of Article Views (full-text article views including HTML views, PDF and ePub downloads, according to the available data) and Abstracts Views on Vision4Press platform.
Data correspond to usage on the plateform after 2015. The current usage metrics is available 48-96 hours after online publication and is updated daily on week days.
Initial download of the metrics may take a while.