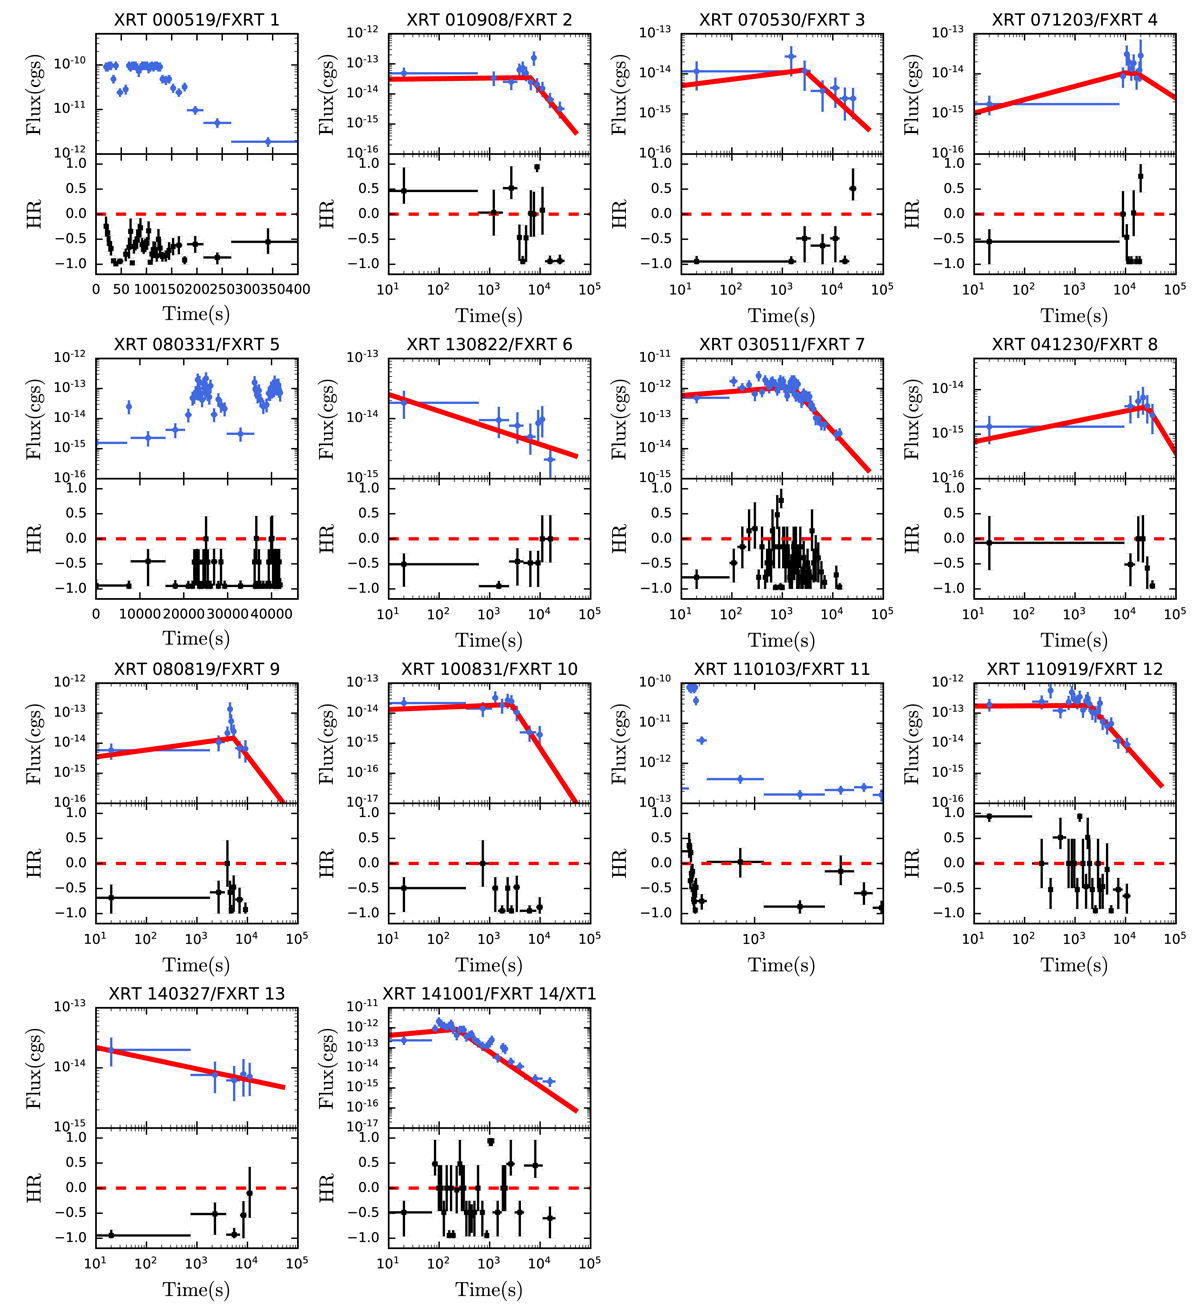
Fig. 9.
Download original image
Light curves, the evolution of the HR over time, and the best fitting models of the FXRT sample. Top panels: observed 0.5–7.0 keV X-ray light curves in cgs units (blue points), starting at T = 20 s. For FXRTs 1 and 11, we only show the main event. For ten FXRT candidates, we also plot the best-fit BPL or simple PL model (red solid lines), while for the remaining four FXRT candidates we do not because they are not well described by either model. The light curves contain five counts per bin (except that of FXRT 1, which has 20 counts per bin). Bottom panels: HR evolution (the soft and hard energy bands are 0.5–2.0 keV and 2.0–7.0 keV, respectively), following the Bayesian method of Park et al. (2006). The dashed red line denotes an HR equal to zero. For XRT 000519/FXRT 1 and XRT 110103/FXRT 11, we show close-ups of the main flare to highlight in more detail their spectral behavior. Here, T0 = 0 s is defined as the time when the count rate is 3σ higher than the Poisson background level.
Current usage metrics show cumulative count of Article Views (full-text article views including HTML views, PDF and ePub downloads, according to the available data) and Abstracts Views on Vision4Press platform.
Data correspond to usage on the plateform after 2015. The current usage metrics is available 48-96 hours after online publication and is updated daily on week days.
Initial download of the metrics may take a while.