Fig. 9.
Download original image
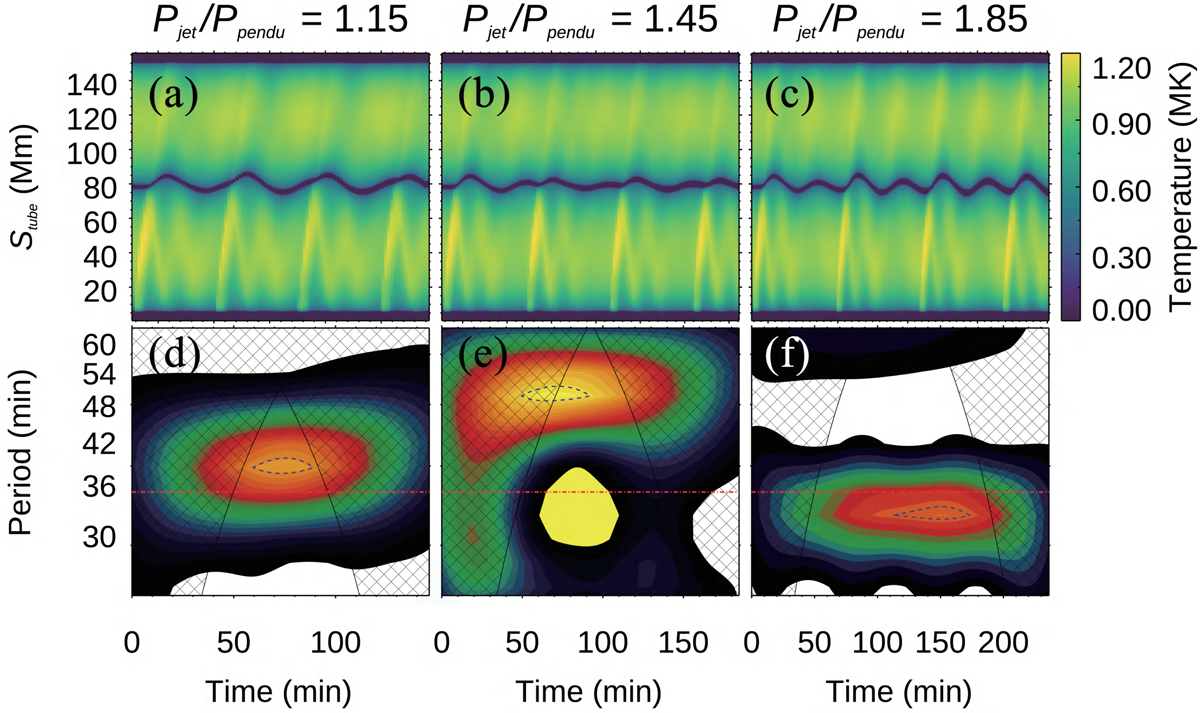
Time-distance diagrams and wavelet analysis of the filament displacement with different quasi-periodic jets. Top row: time-distance diagrams of the temperature distributions in three cases when the driving period of the jets is 1.15Ppendu, 1.45Ppendu, and 1.85Ppendu, respectively. Bottom row: corresponding wavelet periodograms of the three cases, where the dashed black lines correspond to the significance of 95%, and the horizontal red line marks the pendulum period, Ppendu.
Current usage metrics show cumulative count of Article Views (full-text article views including HTML views, PDF and ePub downloads, according to the available data) and Abstracts Views on Vision4Press platform.
Data correspond to usage on the plateform after 2015. The current usage metrics is available 48-96 hours after online publication and is updated daily on week days.
Initial download of the metrics may take a while.