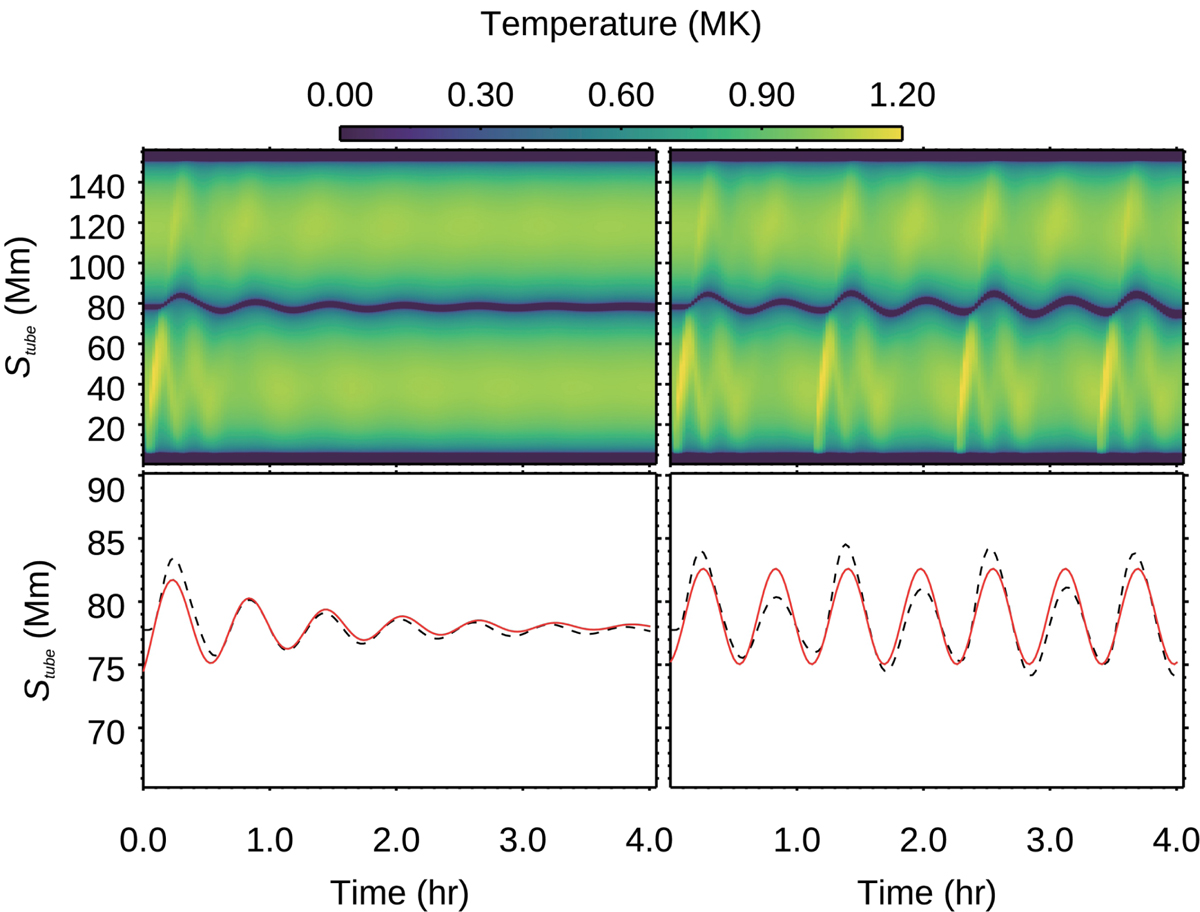
Fig. 7.
Download original image
Top row: time-distance diagrams of the temperature distribution along the magnetic flux tube in the control case (left) and in the multipulse case (right). Bottom row: temporal evolution of the displacement of the filament thread center in the control case (left) and in the multipulse case (right), where the dashed black lines correspond to the simulation results, and the solid red lines correspond to the fitting curves.
Current usage metrics show cumulative count of Article Views (full-text article views including HTML views, PDF and ePub downloads, according to the available data) and Abstracts Views on Vision4Press platform.
Data correspond to usage on the plateform after 2015. The current usage metrics is available 48-96 hours after online publication and is updated daily on week days.
Initial download of the metrics may take a while.