Fig. 5.
Download original image
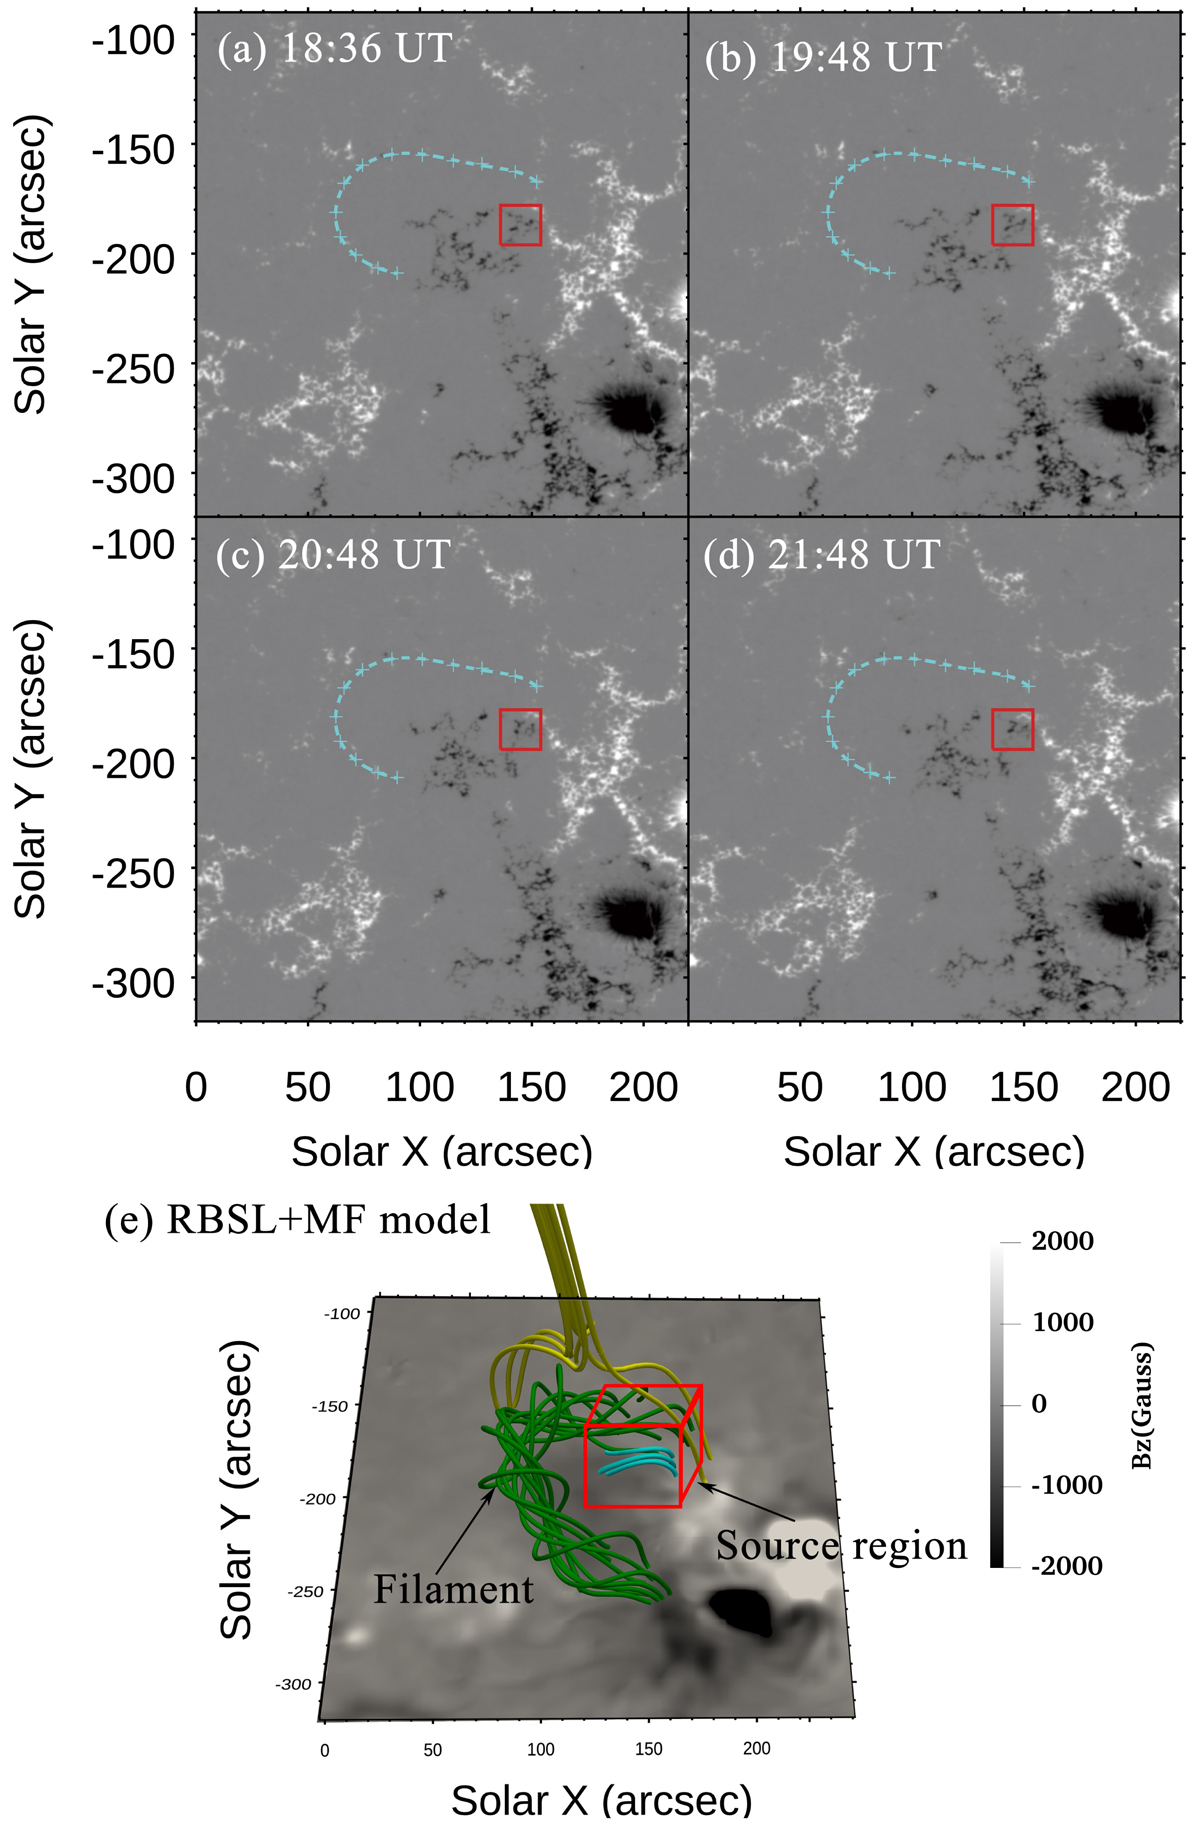
Temporal evolution and nonlinear force-free field extrapolation model of the AR filament. Panels a–d: four snapshots of the SDO/HMI magnetogram around the filament channel, where white and black means positive and negative polarity, and the red squares correspond to the site of the jet source. The filament spine is represented by the dashed cyan lines. Panel e: coronal magnetic field reconstructed using the RBSL flux rope and magneto-frictional model. The green field lines represent the flux rope and the yellow lines indicate that the overlying magnetic field contains a fan-spine structure. The red cube corresponds to the red squares in the top four panels, where magnetic reconnection probably occurred.
Current usage metrics show cumulative count of Article Views (full-text article views including HTML views, PDF and ePub downloads, according to the available data) and Abstracts Views on Vision4Press platform.
Data correspond to usage on the plateform after 2015. The current usage metrics is available 48-96 hours after online publication and is updated daily on week days.
Initial download of the metrics may take a while.