Fig. 1.
Download original image
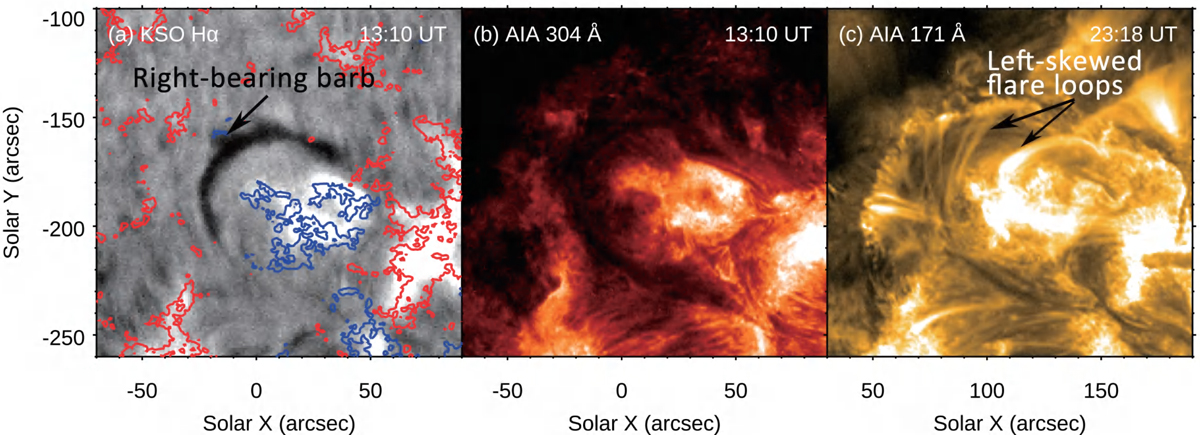
Multiwavelength imaging observations on the AR filament. Panel a: corresponding Hα image of the filament provided by the Kanzelhöhe Observatory at 13:10:46 UT, where the red and blue contour lines represent different levels of magnetic field strength ranging from −50 G to 50 G. The arrow indicates a right-bearing barb of the filament. Panel b: SDO/AIA 304 Å image observed at 13:10:43 UT. Panel c: SDO/AIA 171 Å image observed at 23:19:36 UT. The arrows mark left-skewed flare loops formed after the filament eruption.
Current usage metrics show cumulative count of Article Views (full-text article views including HTML views, PDF and ePub downloads, according to the available data) and Abstracts Views on Vision4Press platform.
Data correspond to usage on the plateform after 2015. The current usage metrics is available 48-96 hours after online publication and is updated daily on week days.
Initial download of the metrics may take a while.