Fig. 9
Download original image
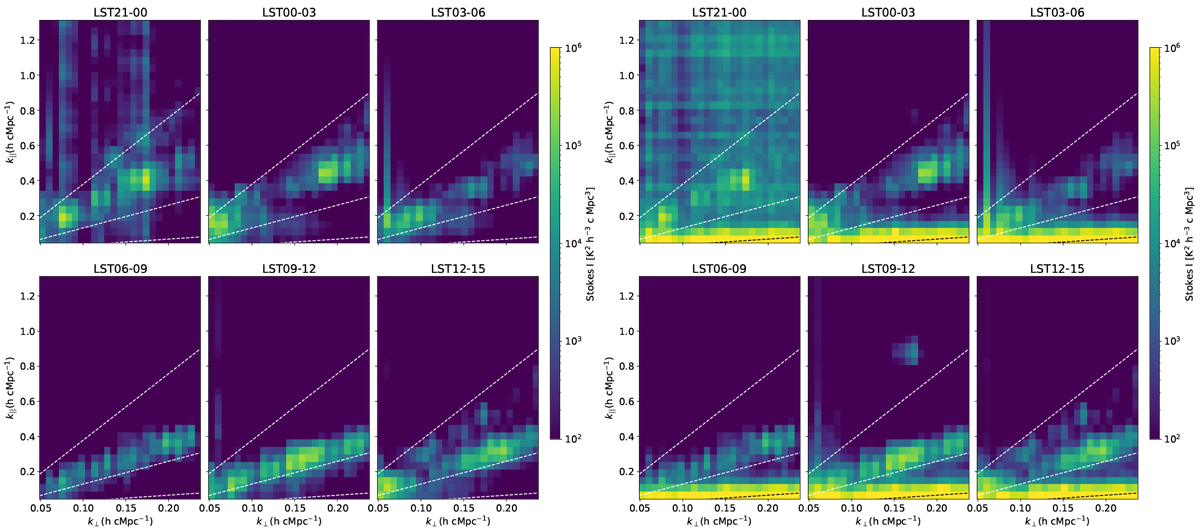
Median cylindrical Stokes I power spectra of the 13 night simulations with two different sky models per LST bin based on the 13 observations including uv-cell flagging. Left: Cas A and Cyg A model. Dashed lines indicate, from bottom to top, 5° (the primary beam), 20° and instrumental horizon delay lines. Right: the DI-calibration model (including the 1416 brightest components that account for ~99% of the flux from our sky model) and Α-team sources. LST03-06 and LST06-09 in both simulations show lower power compared to other LST bins and this trend is consistent with what we have seen with the excess variance in Fig. 7 and the top panel of Fig. 8.
Current usage metrics show cumulative count of Article Views (full-text article views including HTML views, PDF and ePub downloads, according to the available data) and Abstracts Views on Vision4Press platform.
Data correspond to usage on the plateform after 2015. The current usage metrics is available 48-96 hours after online publication and is updated daily on week days.
Initial download of the metrics may take a while.