Fig. 8
Download original image
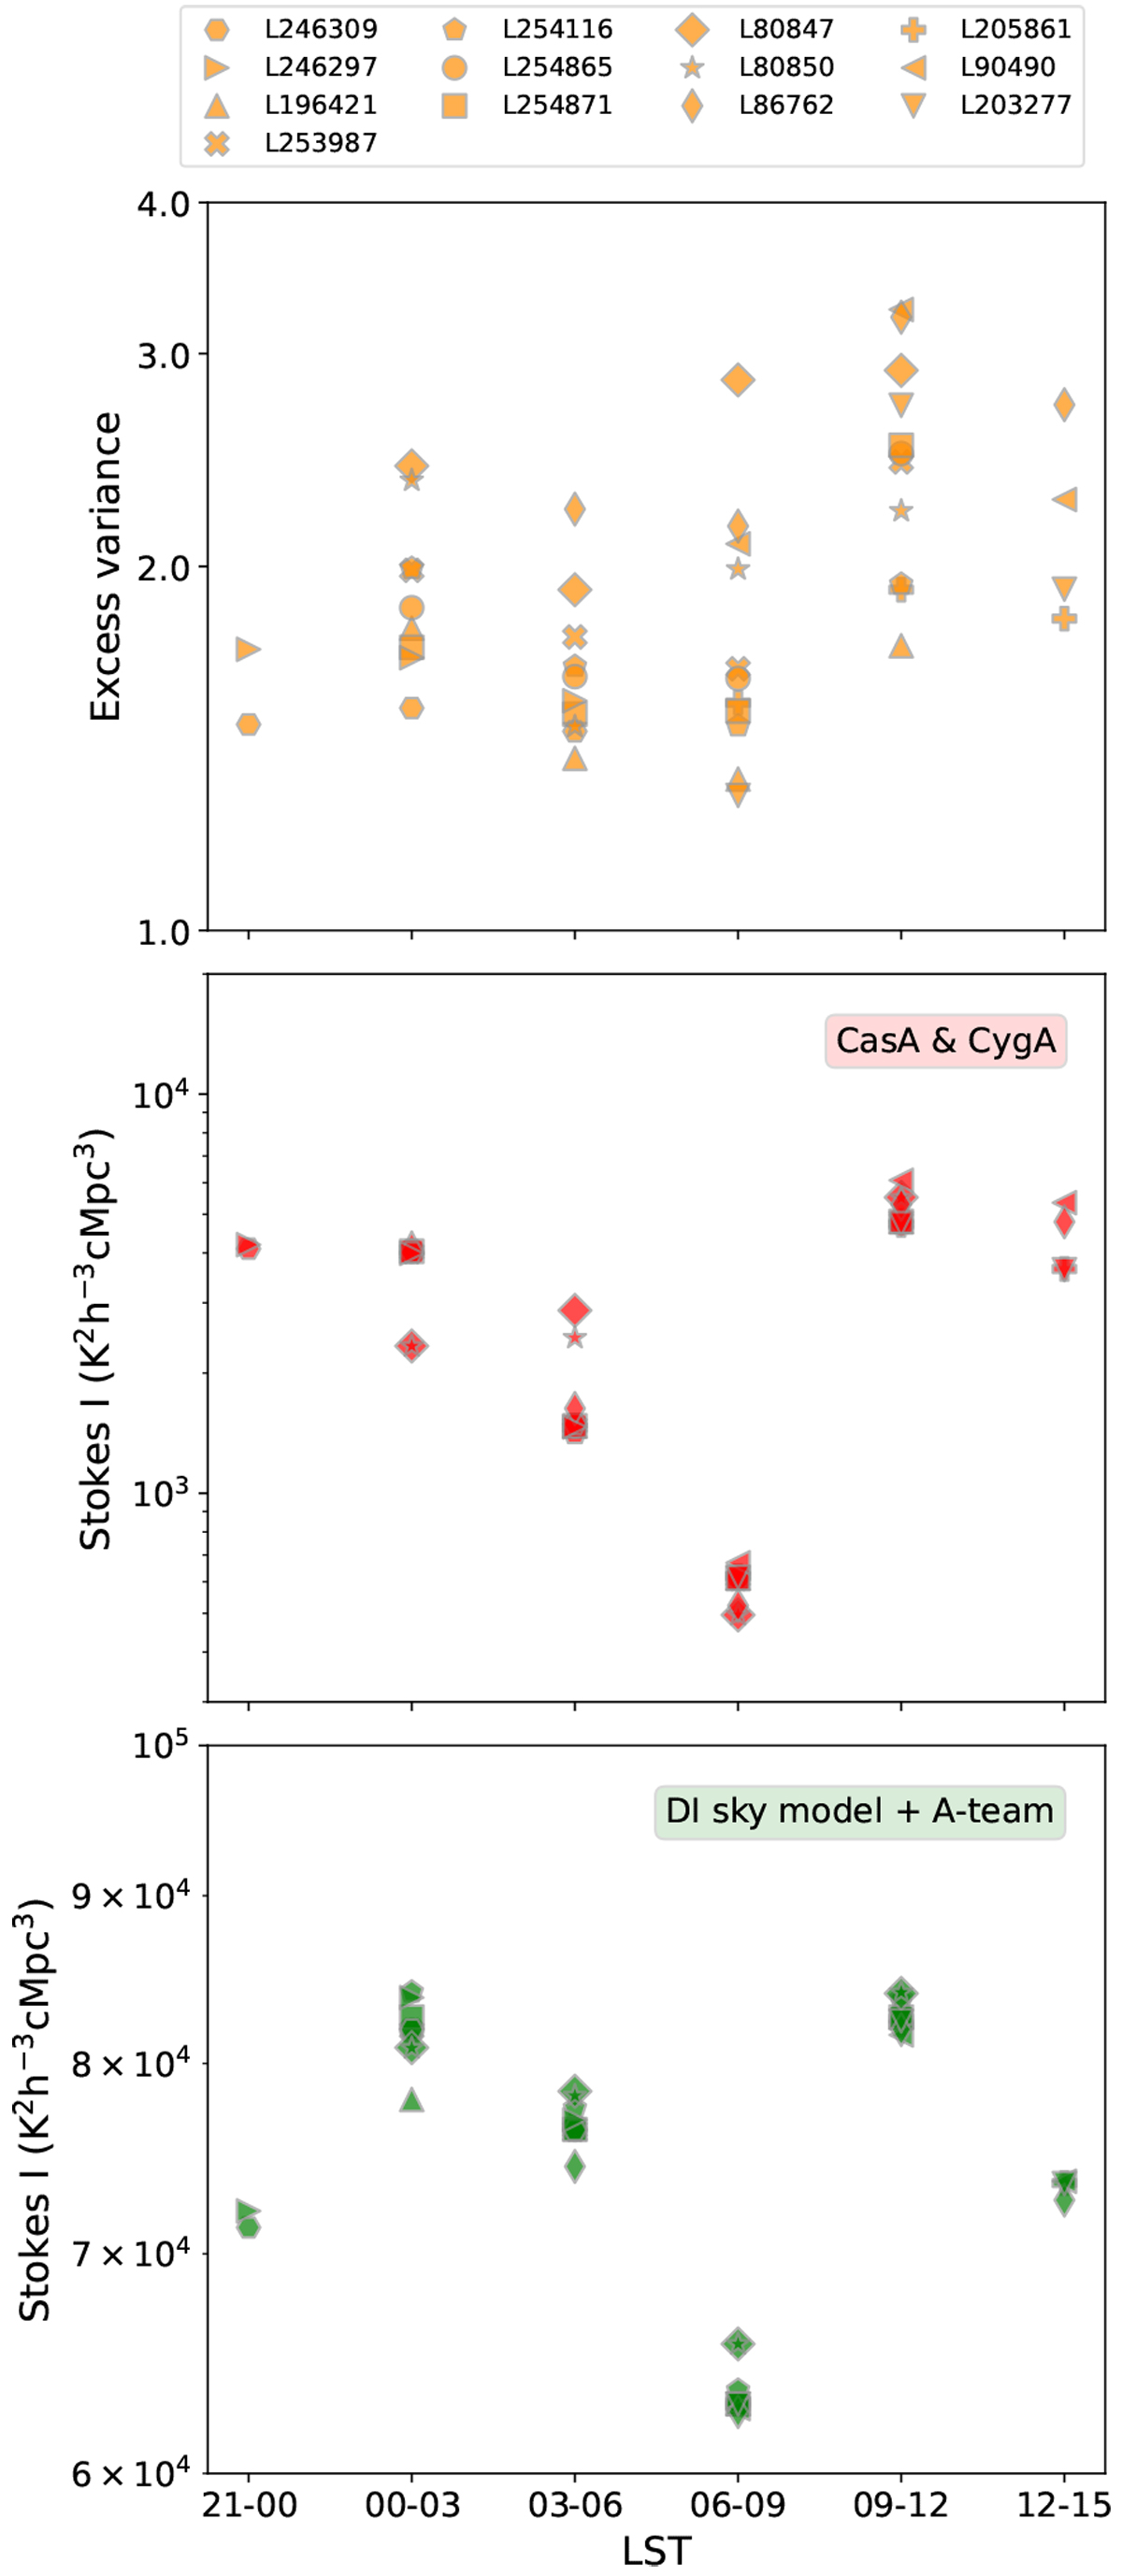
LST-dependence of excess variance and two sky models. Top: excess variance averaged over k per night and per LST in orange. Middle: simulated Stokes I cylindrical power spectra averaged over k per night and LST with Cas A and Cyg A in red. Bottom: simulated Stokes I cylindrical power spectra averaged over k per night and LST with the DI-calibration model (including the 1416 brightest components that account for ~99% of the flux from our sky model) and A-team sources in green. Different markers indicate different observations. The difference between nights in simulations mainly comes from the different number of sub-bands per night (see Table 1) and flagging based on uv-cells. The excess variance from observations and the simulated Stokes I power from the two models (in middle and bottom) shows a similar LST-dependence.
Current usage metrics show cumulative count of Article Views (full-text article views including HTML views, PDF and ePub downloads, according to the available data) and Abstracts Views on Vision4Press platform.
Data correspond to usage on the plateform after 2015. The current usage metrics is available 48-96 hours after online publication and is updated daily on week days.
Initial download of the metrics may take a while.