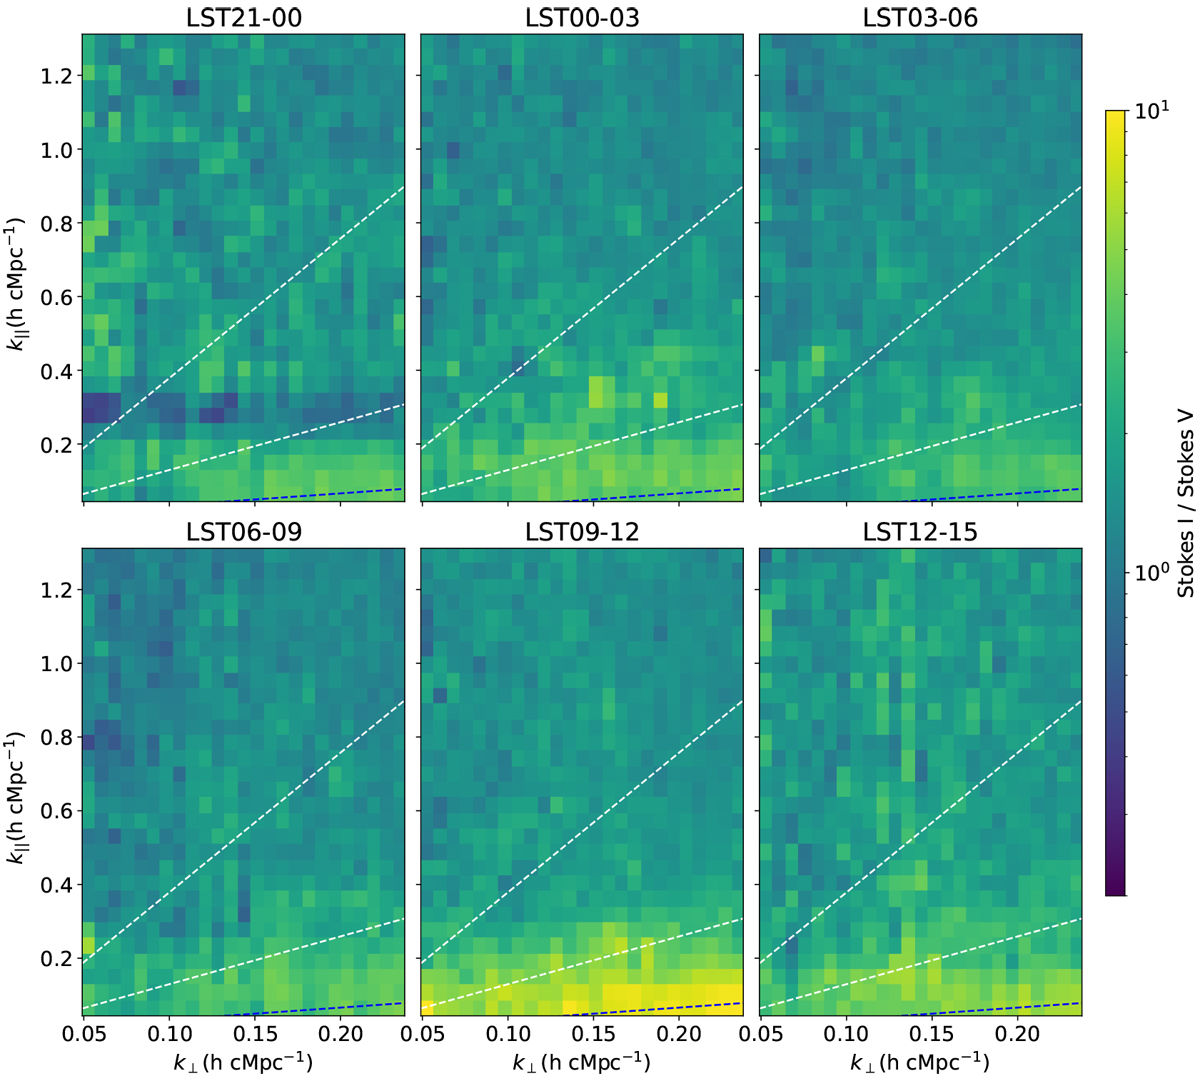
Fig. 7
Download original image
Median value over 13 nights of the ratio (i.e., Stokes I over Stokes V) of the cylindrical power spectra per LST bin. We define this as a cylindrical “excess variance” power spectrum. The dashed lines indicate the 5° (the primary beam; bottom), 20° (middle), and instrumental (top) horizon delay lines, respectively. The excess variance is especially high (>5) in the wedge region below the ~20° delay line in all LST bins. The excess variance has an LST dependence and LST 09-12 has the highest excess power in the wedge region compared to other LST bins.
Current usage metrics show cumulative count of Article Views (full-text article views including HTML views, PDF and ePub downloads, according to the available data) and Abstracts Views on Vision4Press platform.
Data correspond to usage on the plateform after 2015. The current usage metrics is available 48-96 hours after online publication and is updated daily on week days.
Initial download of the metrics may take a while.