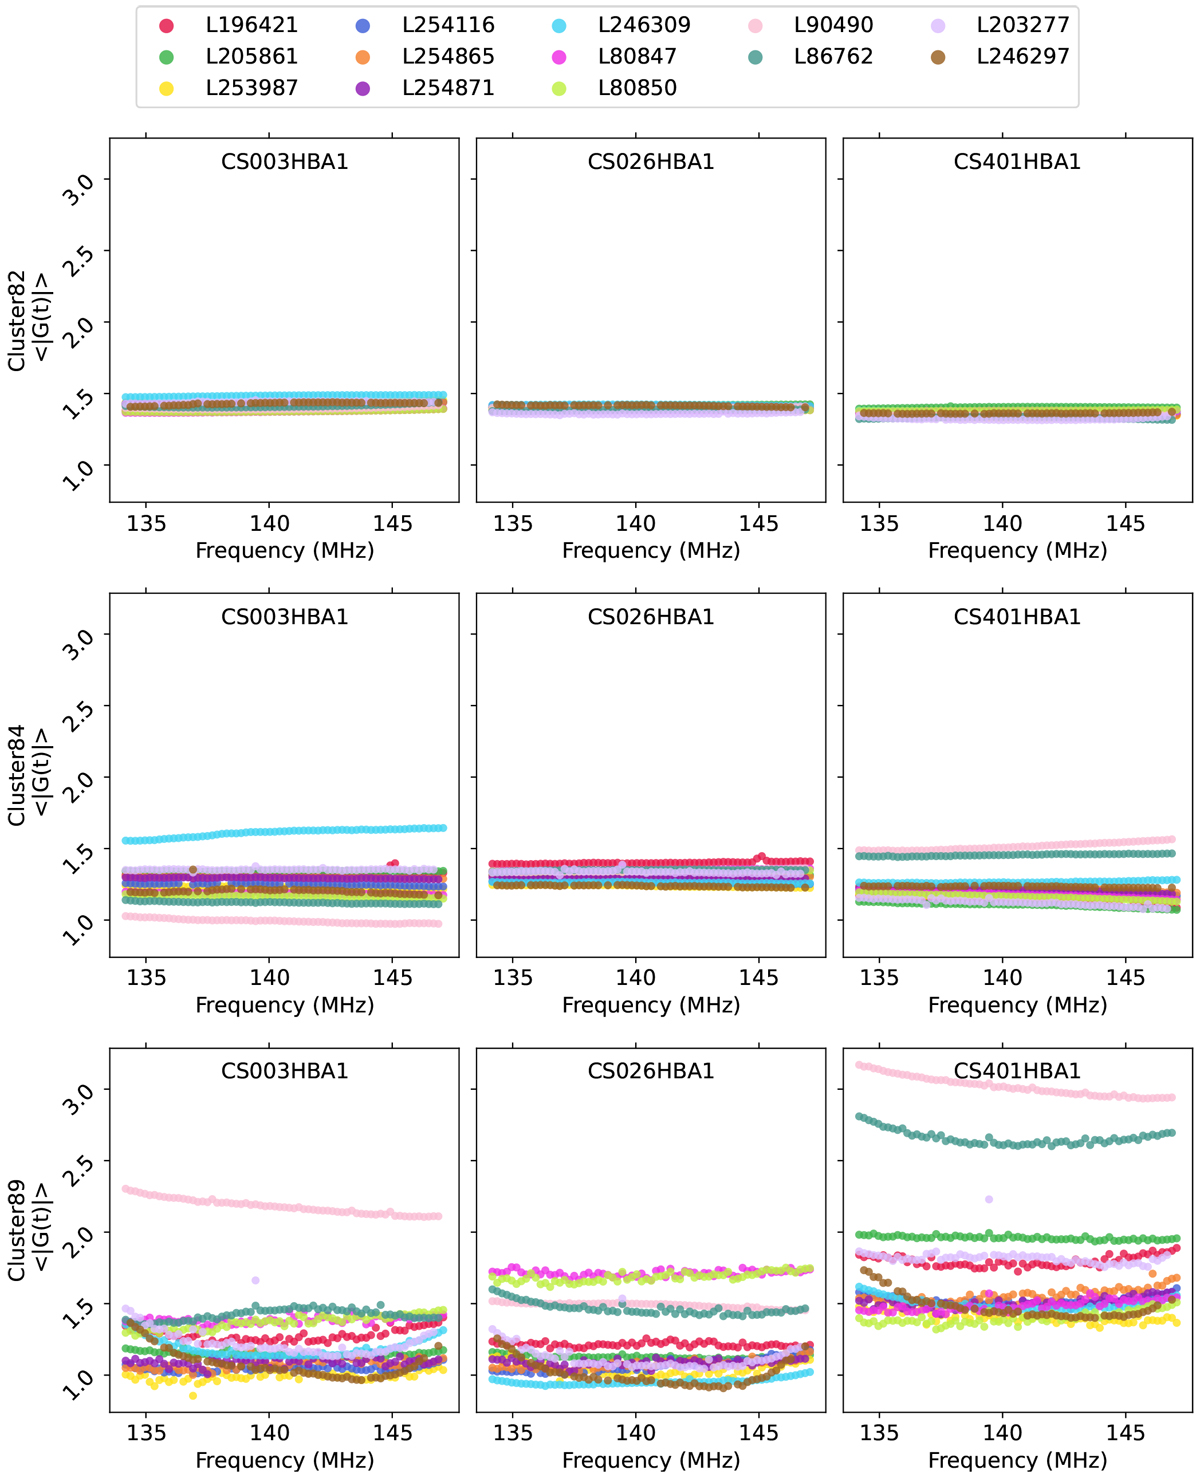
Fig. 4
Download original image
Time-averaged DD-gains as a function of frequency from 13 night LOFAR observations (in different colors) in Cluster82 (top row), Cluster84 (middle row), and Cluster89 (bottom row). The calculated time averages are separately plotted for three chosen core stations – CS003HBA1 (left column), CS026HBA1 (middle column), and CS401HBA1 (right column), respectively. The color code denotes different nights and each data point indicates a time average at a fixed frequency and a night. Time-averaged gains are smoother over frequency as the cluster is closer to the NCP (from bottom to top).
Current usage metrics show cumulative count of Article Views (full-text article views including HTML views, PDF and ePub downloads, according to the available data) and Abstracts Views on Vision4Press platform.
Data correspond to usage on the plateform after 2015. The current usage metrics is available 48-96 hours after online publication and is updated daily on week days.
Initial download of the metrics may take a while.