Fig. A.1
Download original image
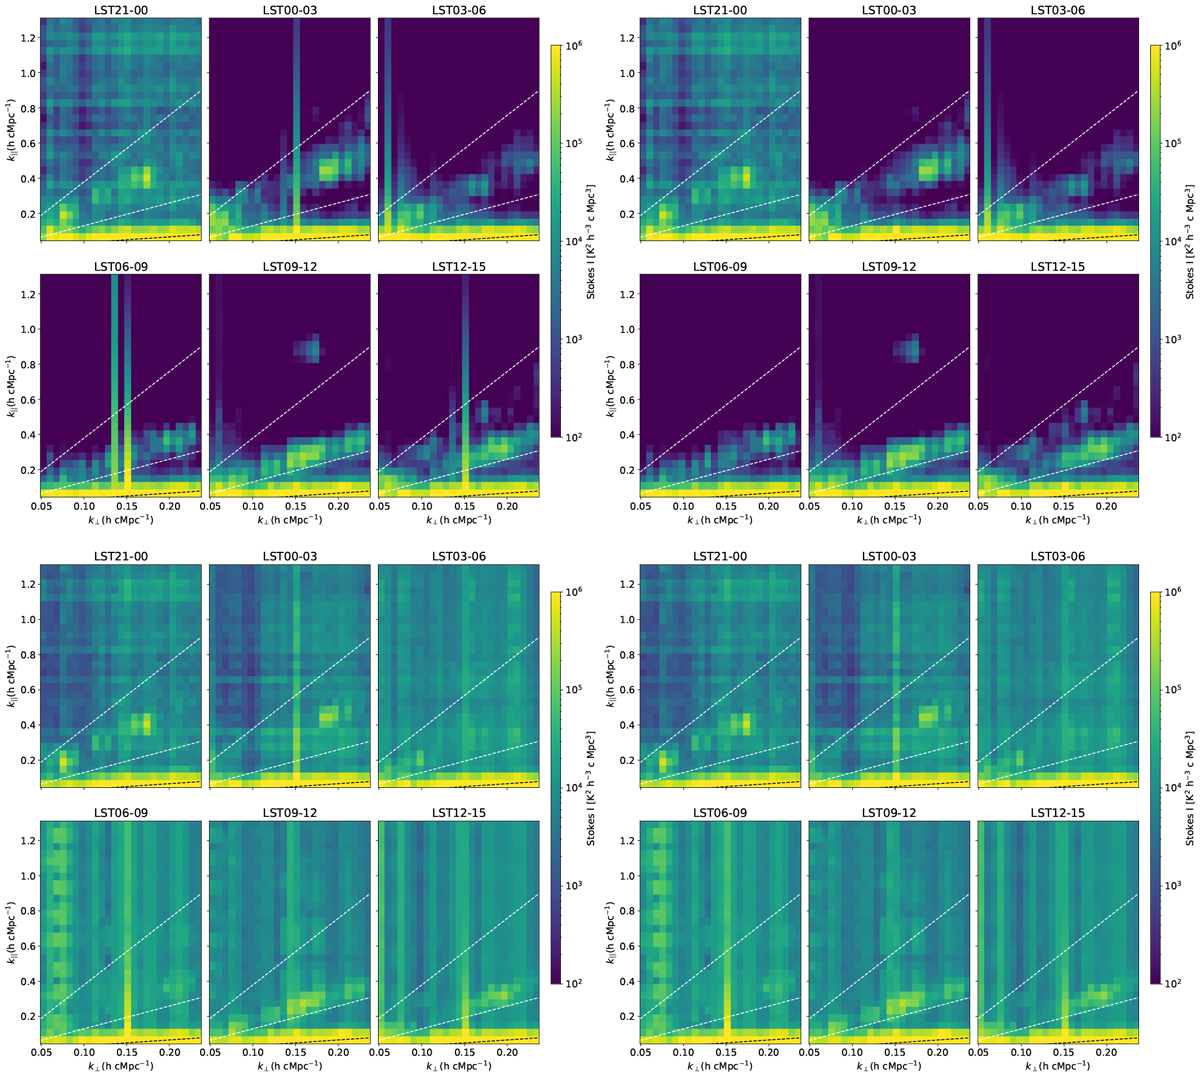
Median cylindrical Stokes I power spectra of the 13 night simulations with the DI-calibration model (including the 1416 brightest components that account for ~99% of the flux from our sky model) and Α-team sources per LST bin with 4 different flagging conditions. Top left: uv-cells not flagged and RFI unflagged. Top right: uv-cells flagged and RFI unflagged (the condition we use for the analysis). Bottom left: uv-cells not flagged and RFI flagged. Bottom right: uv-cells flagged and RFI flagged. Dashed lines indicate, from bottom to top, 5° (the primary beam), 20° and instrumental horizon delay lines. RFI flagging adds extra power to the EoR window (bottom left and right) and unflagged bad uv-cells add vertical structures in the power spectra (top left). Hence, applying uv-cell flagging and unflagging RFI (top right) is optimal for the power spectrum estimation in this case.
Current usage metrics show cumulative count of Article Views (full-text article views including HTML views, PDF and ePub downloads, according to the available data) and Abstracts Views on Vision4Press platform.
Data correspond to usage on the plateform after 2015. The current usage metrics is available 48-96 hours after online publication and is updated daily on week days.
Initial download of the metrics may take a while.