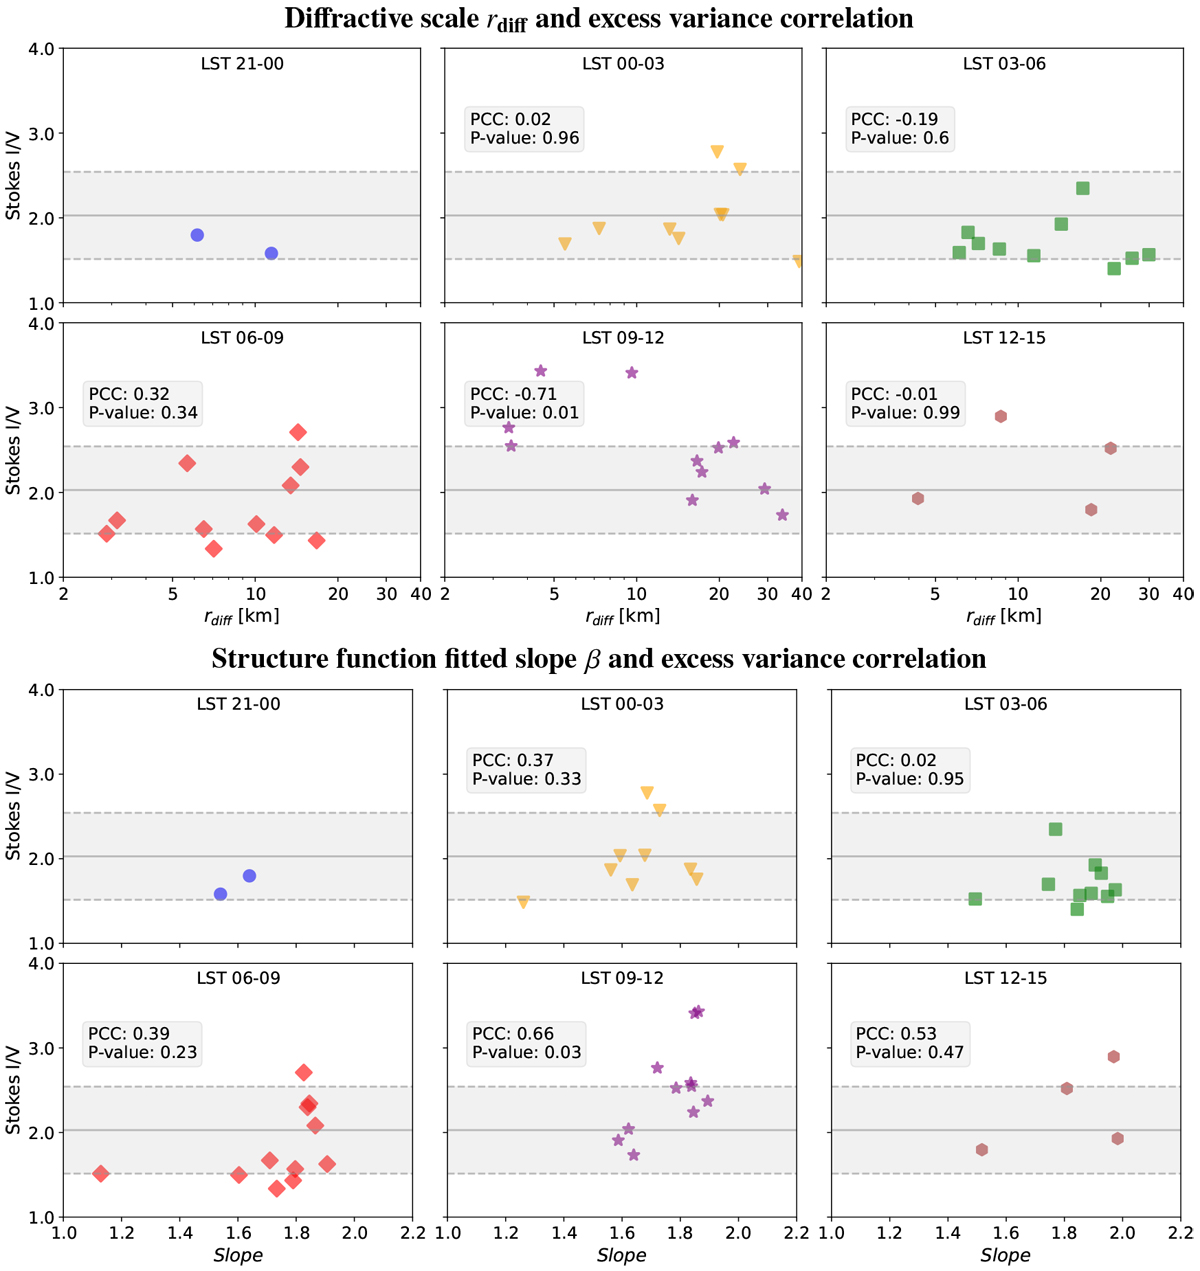
Fig. 14
Download original image
Excess variance (i.e., the Stokes I and V ratio) as a function of diſſractive scale rdiff (top two rows) and fitted slope β (bottom two rows) at 140 MHz per LST bin for 13 observations with the shaded area indicating the 1 – σ excess variance over 13 observations and all LST bins. The color denotes different LST bins. The ionosphere and excess variance distributions vary from night to night (different data points per LST bin) and also from LST to LST. No strong correlation between the excess variance and the diſſractive scale is found at the current level.
Current usage metrics show cumulative count of Article Views (full-text article views including HTML views, PDF and ePub downloads, according to the available data) and Abstracts Views on Vision4Press platform.
Data correspond to usage on the plateform after 2015. The current usage metrics is available 48-96 hours after online publication and is updated daily on week days.
Initial download of the metrics may take a while.