Fig. 13
Download original image
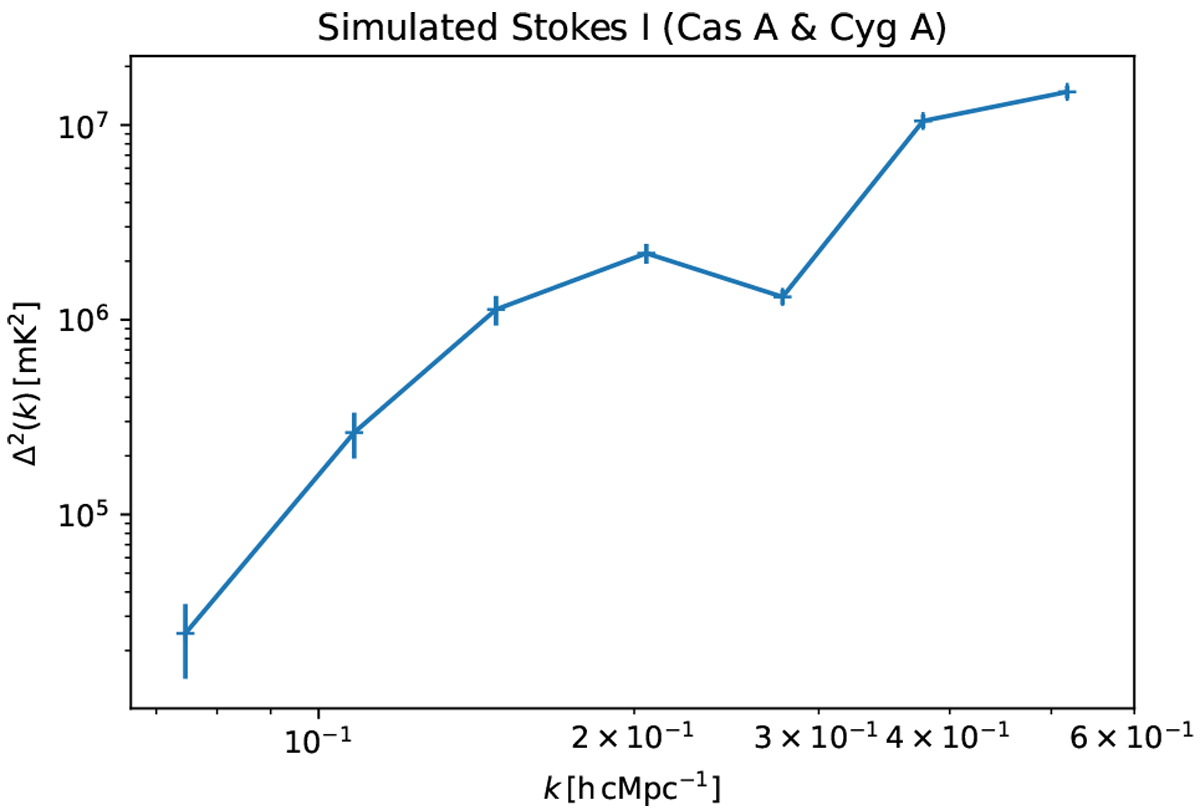
Spherically averaged power spectrum estimated from one-night (L246309) Cas A and Cyg A only simulation. Compared the Cas A and Cyg A introduced Stokes I power to the estimated 21 cm signal at k = 0.1 hc Mpc–1, the Cas A and Cyg A power should be reduced by ~99.3% or even higher in the calibration to be able to distinguish the 21 cm signal from the Cas A and Cyg A power.
Current usage metrics show cumulative count of Article Views (full-text article views including HTML views, PDF and ePub downloads, according to the available data) and Abstracts Views on Vision4Press platform.
Data correspond to usage on the plateform after 2015. The current usage metrics is available 48-96 hours after online publication and is updated daily on week days.
Initial download of the metrics may take a while.