Fig. 12
Download original image
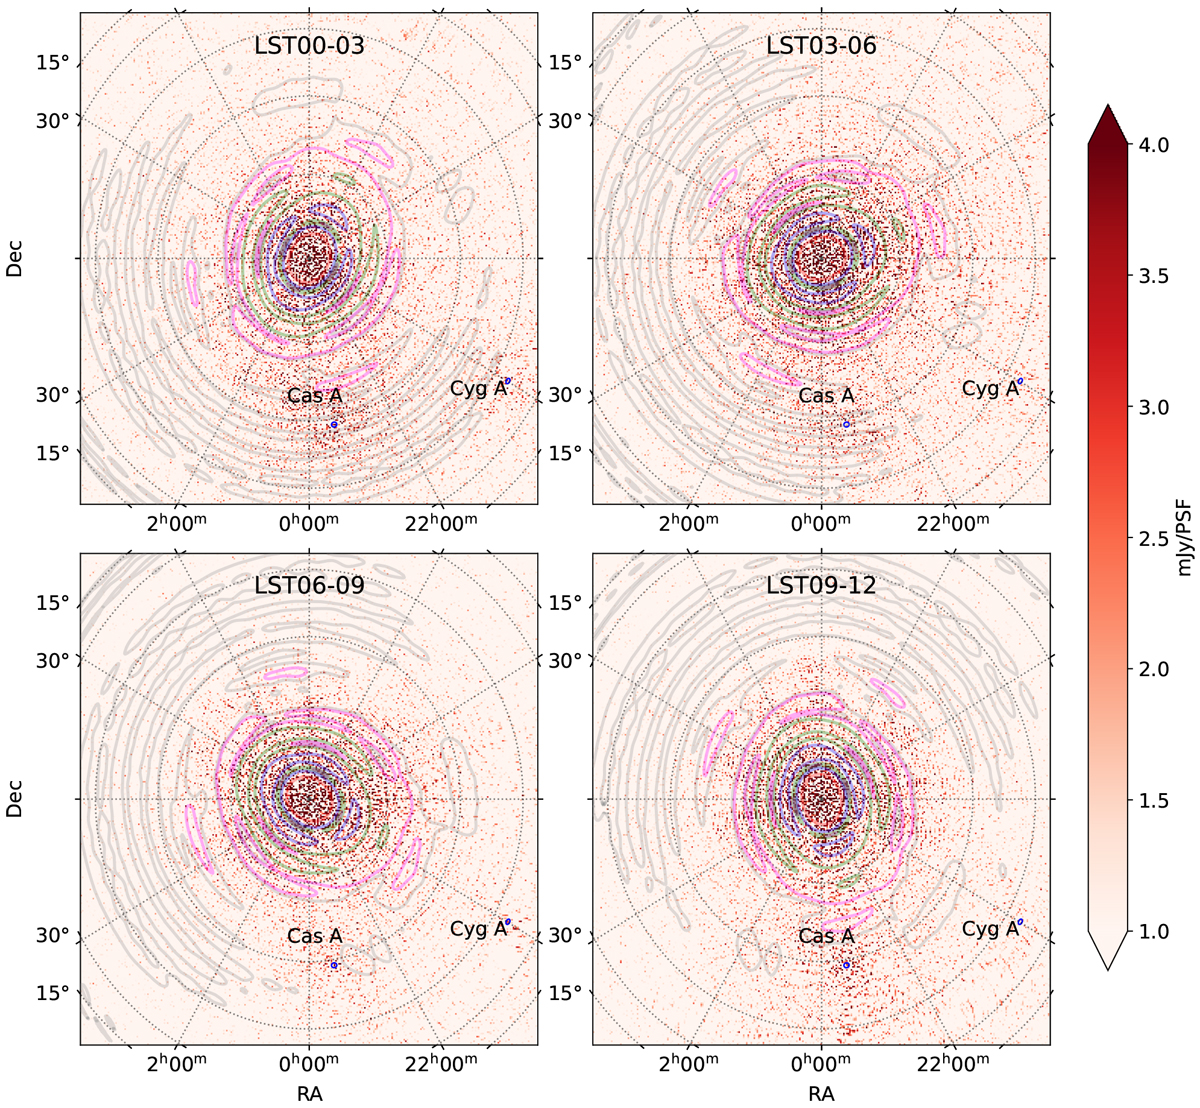
Very wide images after DD-calibration from observation L254116 combining 62 sub-bands with the position of Cas A and Cyg A and the time- and frequency-averaged beam patterns overlaid. From inside to outside, different color (red, blue, green, magenta, and gray) indicate different beam gains, corresponding to –10 dB, –20 dB, –30 dB, –40 dB, and –50 dB. The actual excess variance we see in the power spectra should be the multiplication of the residual Stokes I power and the beam effects. In the sky images, we see the extra power coming especially from the Cas A direction. This power is at its peak in LST00-03, decreasing in LST06-09 and increasing again in LST09-12. This tendency corresponds with what we observed in the LST progression of excess variance and the simulated power of Cas A and Cyg A in the top and middle panels of Fig. 8. The averaged beam rotates over time, as we can see in the images, the –50 dB sidelobe (in gray) sweeps through Cas A and Cyg A from LST00-03 to LST09-12. In the first three LST slices, the sidelobes rotate away from Cas A and Cyg A, at the same time, the power from Cas A and Cyg A decreases. As aresult, the excess variance effect from Cas A and Cyg A decreases from LST00-03 to LST06-09. In LST09-12, although the –50 dB envelope is located in the opposite direction of Cas A and Cyg A, the –40 dB sidelobe (in magenta) has an extended arm towards Cas A direction and the extra power from Cas A direction increases again. This combined effect results in increased power in LST09-12, as we see in Fig. 8.
Current usage metrics show cumulative count of Article Views (full-text article views including HTML views, PDF and ePub downloads, according to the available data) and Abstracts Views on Vision4Press platform.
Data correspond to usage on the plateform after 2015. The current usage metrics is available 48-96 hours after online publication and is updated daily on week days.
Initial download of the metrics may take a while.