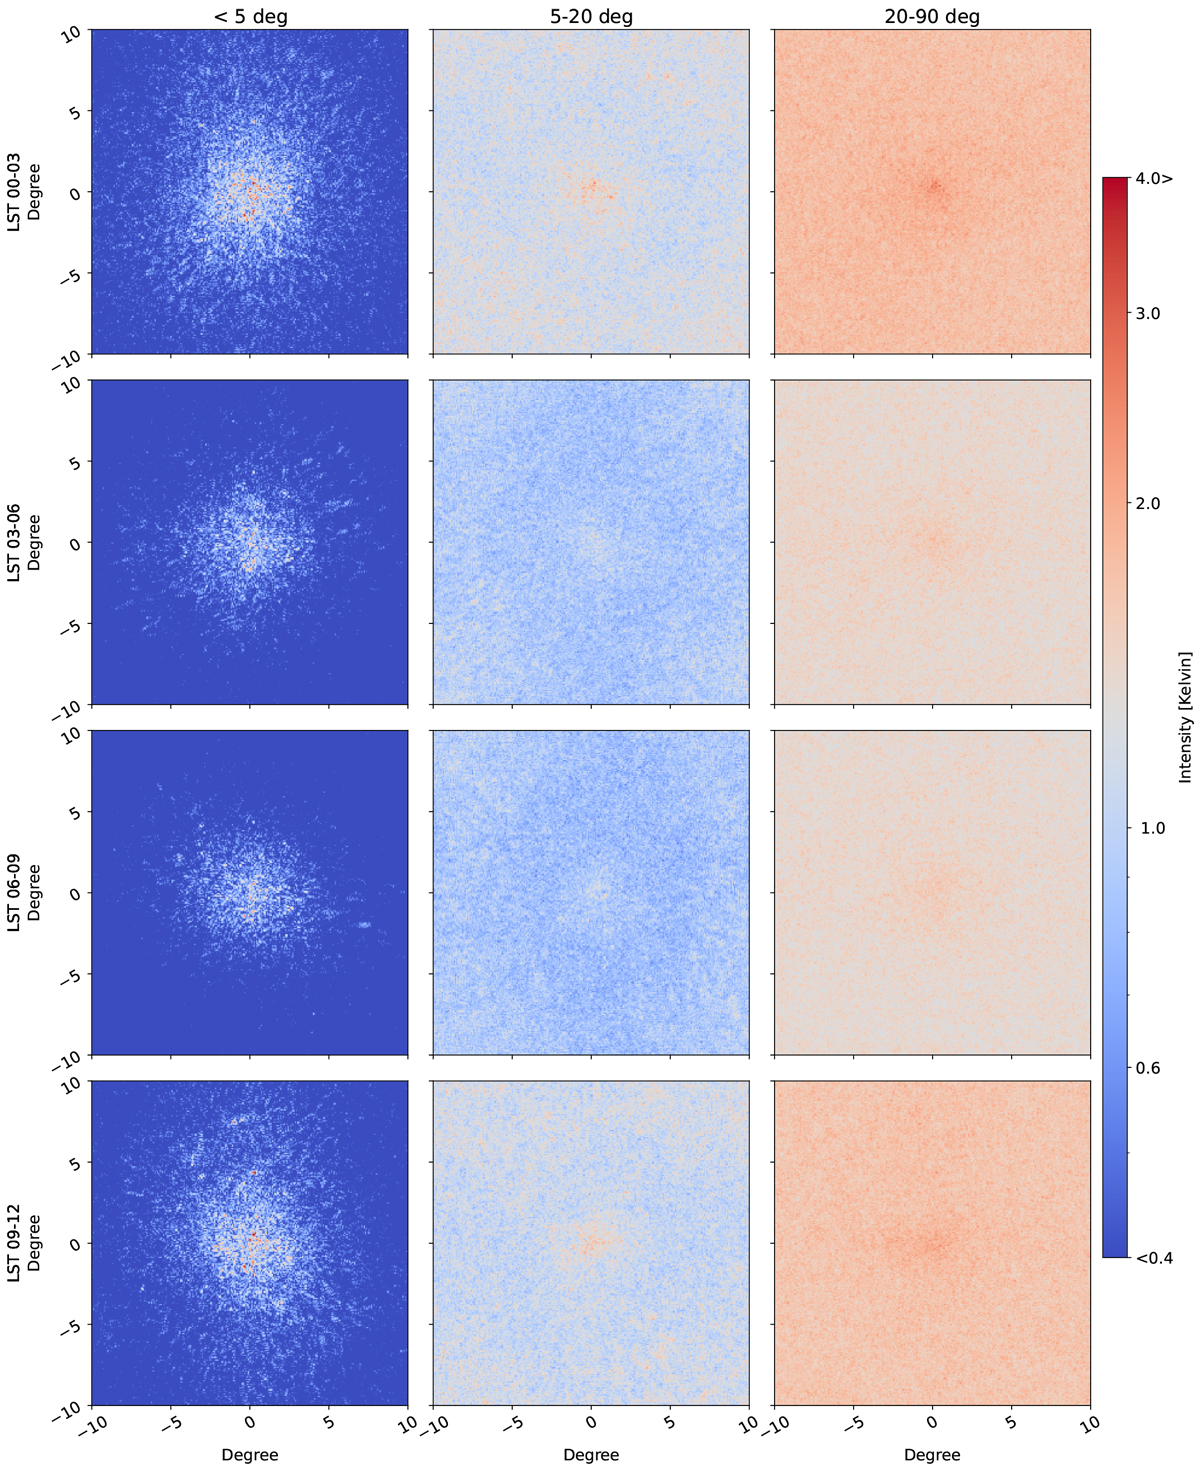
Fig. 11
Download original image
Standard deviation of the residual Stokes I intensities along the frequency direction, after sky-model subtraction and GPR residual foreground removal at 2.5 arcmin resolution incoherently averaged over seven nights per 3 h LST from different regions of (k⊥, k‖) space – passing only the data under 5° delay line (first column), between 5° and 20° delay lines (second column), between 20° and 90° delay lines (third column) in the power spectra, respectively. All images are in units of Kelvin. As we show in Fig. 7 LST03-06 and LST06-09 once again show lower residual power compared to other LST bins.
Current usage metrics show cumulative count of Article Views (full-text article views including HTML views, PDF and ePub downloads, according to the available data) and Abstracts Views on Vision4Press platform.
Data correspond to usage on the plateform after 2015. The current usage metrics is available 48-96 hours after online publication and is updated daily on week days.
Initial download of the metrics may take a while.