Fig. 10
Download original image
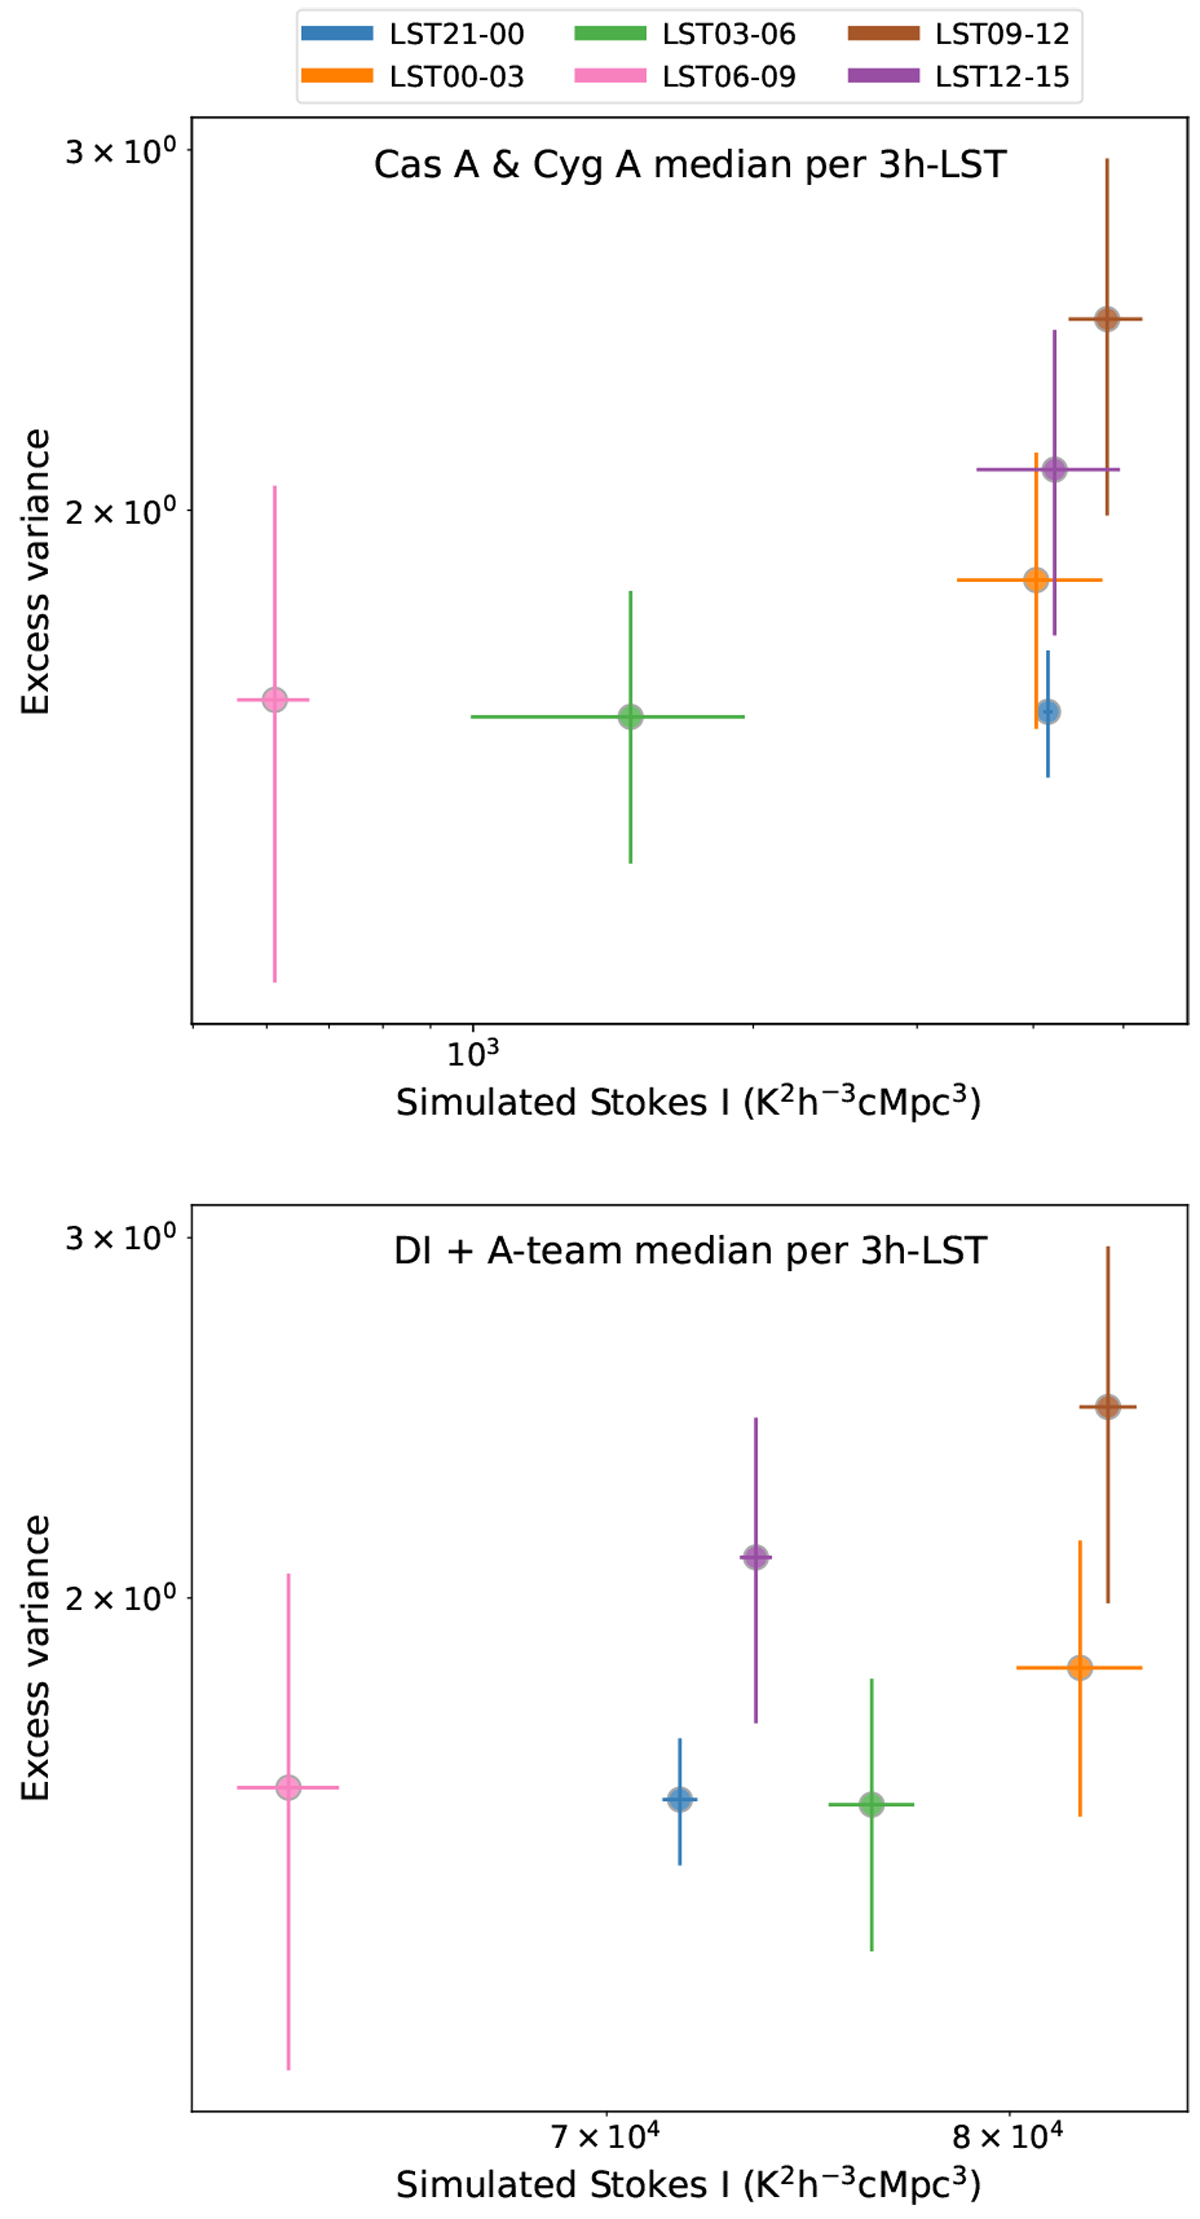
Correlation between the median simulated Stokes I from two sky models and the median excess variance over LST. Top: correlation between the Cas A and Cyg A model and excess variance over LST. Bottom: correlation between the DI sky model (that accounts for ~99% of the power in the sky model) and Α-team sources and excess variance over LST. Different colors indicate different LST bins. The error bars on each data point indicate the RMS of the simulated Stokes I power and the excess variance between nights per LST bin, respectively (we note that they are not observation errors), to show the night-to-night spread of the data per LST bin. The correlation between the simulated power from the two models and the excess variance show a moderate correlation but it is not strong, due to the limited sample size and night-to-night spread of the data.
Current usage metrics show cumulative count of Article Views (full-text article views including HTML views, PDF and ePub downloads, according to the available data) and Abstracts Views on Vision4Press platform.
Data correspond to usage on the plateform after 2015. The current usage metrics is available 48-96 hours after online publication and is updated daily on week days.
Initial download of the metrics may take a while.