Fig. 1
Download original image
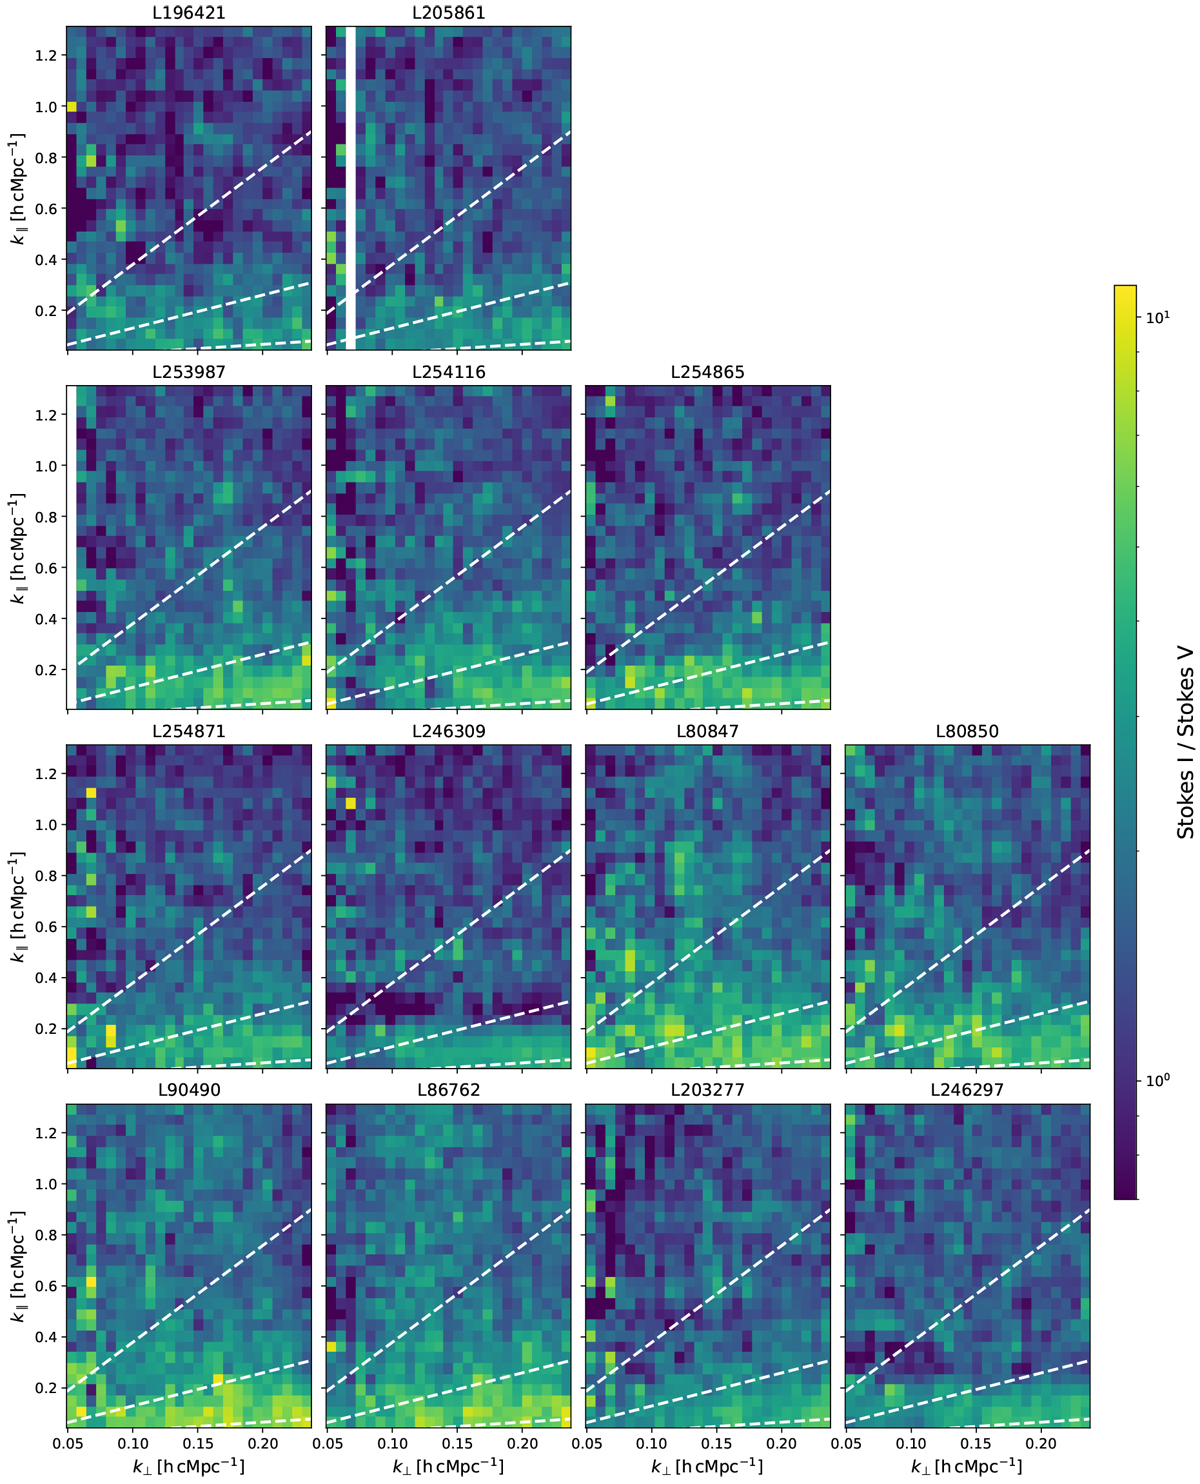
Excess variance power spectra ratios (i.e., the Stokes I over Stokes V ratio) for the 13 nights of LOFAR observations after DI and DD calibration and foreground removal (sky model and GPR). The dashed lines indicate, from bottom to top, the 5° (the primary beam), 20°, and instrumental horizon delay lines. The excess variance is larger in the wedge-like region under the dashed lines. Some baselines are flagged in L205852 (k⊥ ~ 0.07 hc Mpc–1) and in L253987 (k⊥ ~ 0.05 hc Mpc–1).
Current usage metrics show cumulative count of Article Views (full-text article views including HTML views, PDF and ePub downloads, according to the available data) and Abstracts Views on Vision4Press platform.
Data correspond to usage on the plateform after 2015. The current usage metrics is available 48-96 hours after online publication and is updated daily on week days.
Initial download of the metrics may take a while.