Fig. 2
Download original image
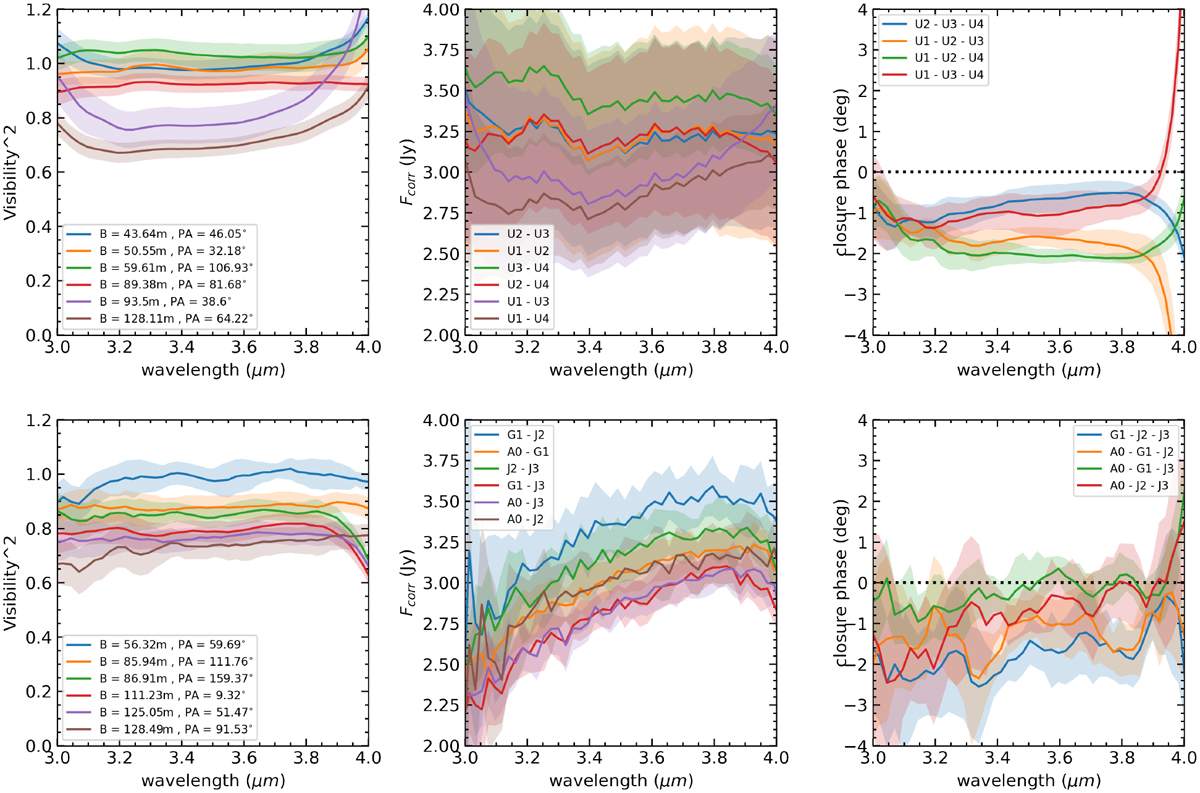
MATISSE squared visibilities, correlated fluxes, and closure phases in the L band. First row: data from epoch 4 (UTs) and the bottom row data from epoch 5 (ATs). The visibilities and correlated fluxes are color-coded with respect to the baselines, as shown in the legends, while closure phases have a different color scheme (per baseline triangle). The apparent flaring in the data below 3.2 µm and beyond 3.9 µm is a known instrumental artifact at the edges of the atmospheric transmission windows.
Current usage metrics show cumulative count of Article Views (full-text article views including HTML views, PDF and ePub downloads, according to the available data) and Abstracts Views on Vision4Press platform.
Data correspond to usage on the plateform after 2015. The current usage metrics is available 48-96 hours after online publication and is updated daily on week days.
Initial download of the metrics may take a while.