Fig. 1
Download original image
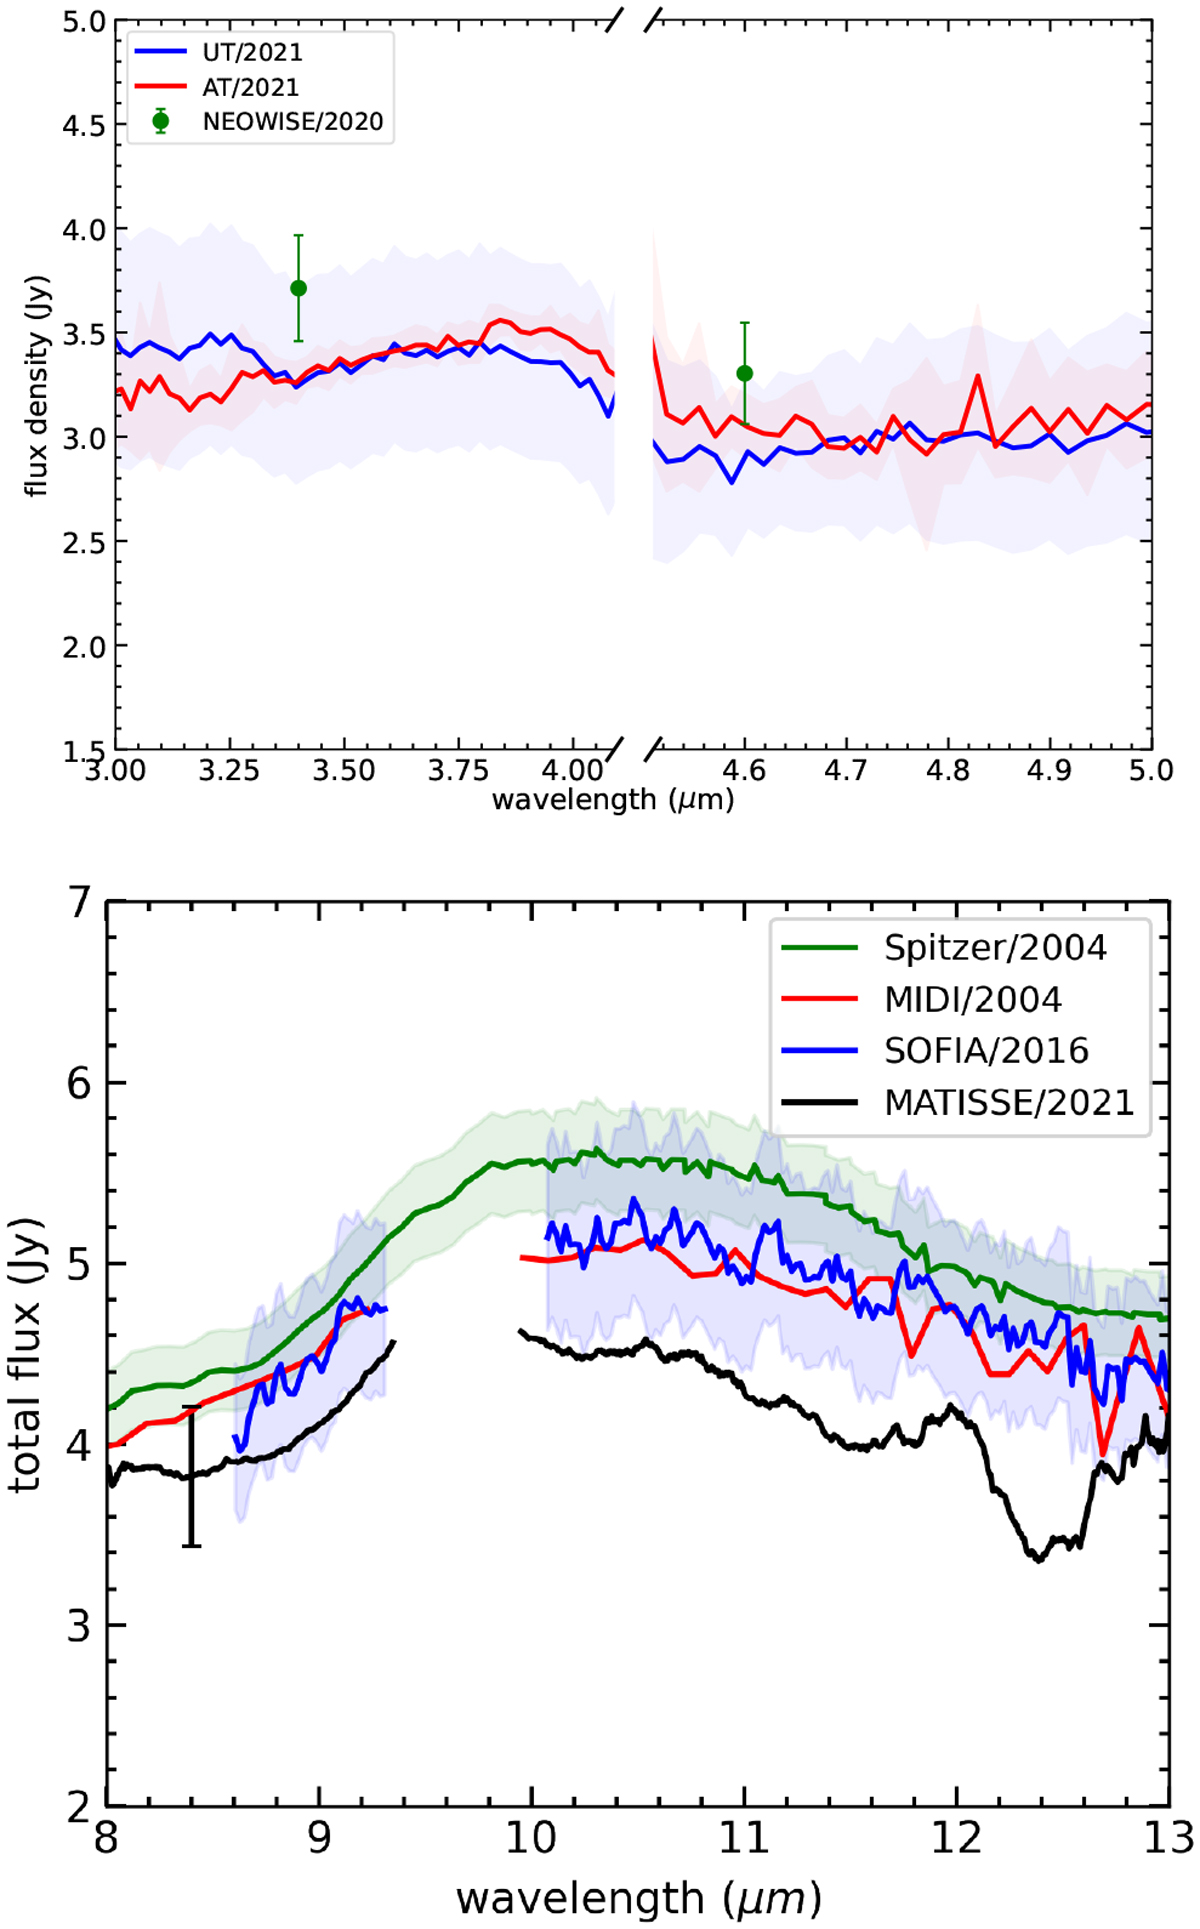
MATISSE total flux spectra. Top: L and M band from the UTs (blue) and the ATs (red; GRA4MAT) from epochs 4 and 5, respectively (Table B.1). NEOWISE photometry from 2020 (corrected for saturation) is shown for comparison (green). Bottom: N-band spectrum (black; UTs) against earlier spectra from Spitzer (green; Green et al. 2006), MIDI (red; Quanz et al. 2006), and SOFIA (blue; Green et al. 2016). The flux uncertainty of MATISSE is about 10% for the case of FU Ori (error bar in the lower panel). Spectral regions where atmospheric transmittance hinders terrestrial observations are cut off from the spectra.
Current usage metrics show cumulative count of Article Views (full-text article views including HTML views, PDF and ePub downloads, according to the available data) and Abstracts Views on Vision4Press platform.
Data correspond to usage on the plateform after 2015. The current usage metrics is available 48-96 hours after online publication and is updated daily on week days.
Initial download of the metrics may take a while.