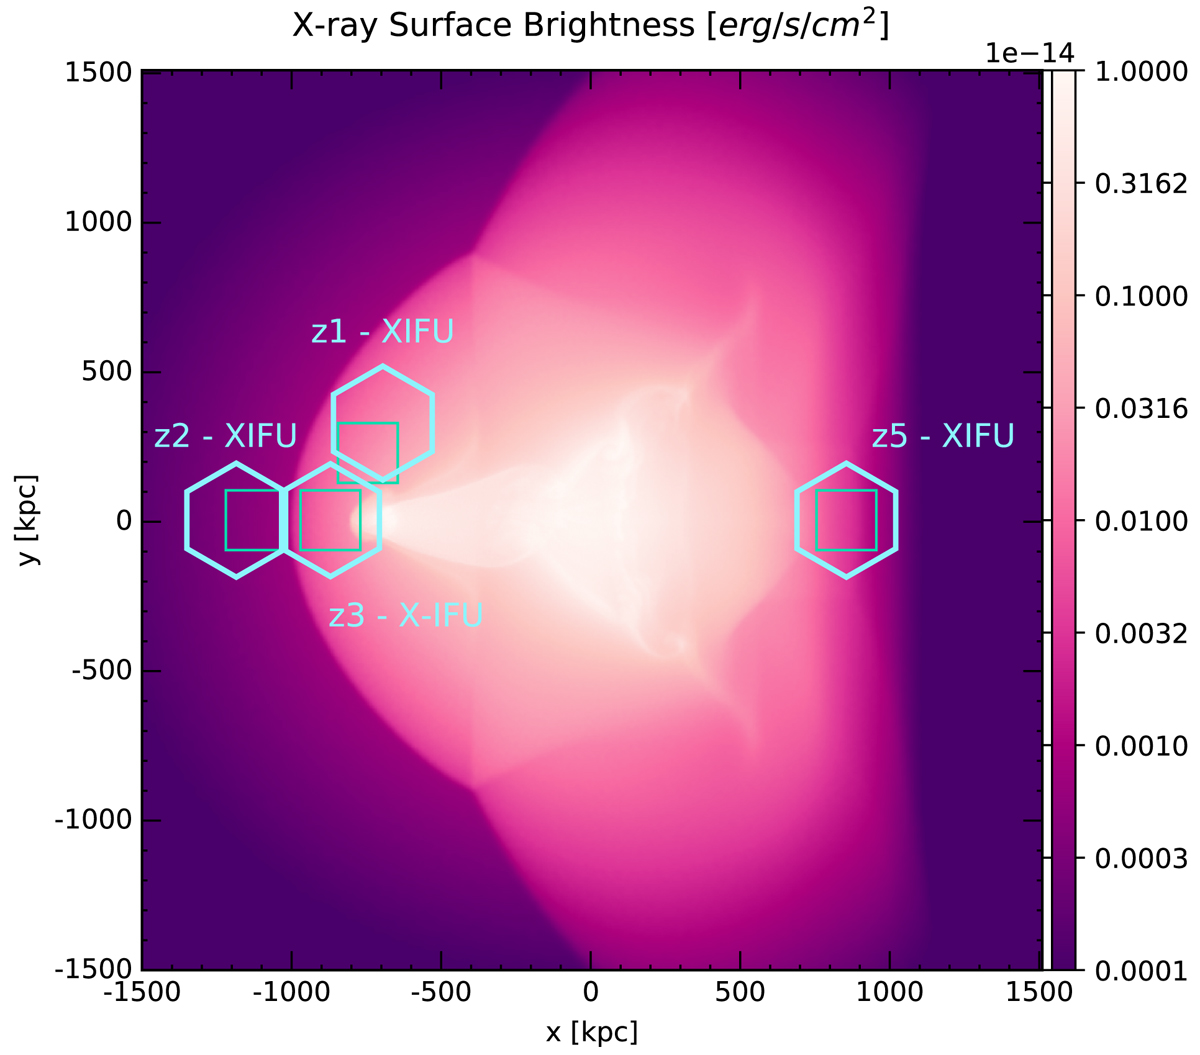
Fig. 6.
Download original image
Simulation map of the X-ray flux in the 0.5−7 keV band, same as in Fig. 1. Overplotted, the four hexagonal X-IFU-like pointings, centered on the faintest regions discussed in Sect. 4.1.2 (z1, z2, z3 and z5) – marked here as thin green squares for comparison. The X-IFU hexagonal pointing covers a region of 5′ equivalent diameter (corresponding to ∼330 kpc at the fiducial redshift of z = 0.057).
Current usage metrics show cumulative count of Article Views (full-text article views including HTML views, PDF and ePub downloads, according to the available data) and Abstracts Views on Vision4Press platform.
Data correspond to usage on the plateform after 2015. The current usage metrics is available 48-96 hours after online publication and is updated daily on week days.
Initial download of the metrics may take a while.